GLOBAL ECONOMICS AND POLITICS

Leo Haviland provides clients with original, provocative, cutting-edge fundamental supply/demand and technical research on major financial marketplaces and trends. He also offers independent consulting and risk management advice.

Haviland’s expertise is macro. He focuses on the intertwining of equity, debt, currency, and commodity arenas, including the political players, regulatory approaches, social factors, and rhetoric that affect them. In a changing and dynamic global economy, Haviland’s mission remains constant – to give timely, value-added marketplace insights and foresights.

Leo Haviland has three decades of experience in the Wall Street trading environment. He has worked for Goldman Sachs, Sempra Energy Trading, and other institutions. In his research and sales career in stock, interest rate, foreign exchange, and commodity battlefields, he has dealt with numerous and diverse financial institutions and individuals. Haviland is a graduate of the University of Chicago (Phi Beta Kappa) and the Cornell Law School.


Subscribe to Leo Haviland’s BLOG to receive updates and new marketplace essays.

RSS View Leo Haviland's LinkedIn profile View Leo Haviland’s profile



DO WHAT WE MUST: EUROZONE THEATRICS © Leo Haviland January 3, 2015

In the relatively near future, the European Central Bank probably will declare it will embark on more extensive quantitative easing (money printing) via purchasing Eurozone sovereign debt in secondary marketplaces. Assorted intertwined variables invite dramatic action. First, the ECB’s creative measures of the past several months have accomplished little. Think of negative policy interest rates. Marketplace response to the Targeted Longer Term Refinancing Operations (TLTRO) has been uninspiring. The ECB underscores its determination to significantly expand its balance sheet. Nevertheless, its current money printing scheme, which purchases asset-backed securities and covered bonds, thus far appears relatively modest to most audiences.

Moreover, the ECB’s fear of insufficient inflation (the deflation spectre) has increased in recent weeks, partly due to the continued bloody tumble in the petroleum complex. In its early December 2014 meeting, it underlined the Eurozone’s mediocre economic growth realities and prospects.

Potential for notable social unrest on the European scene exists. Unemployment remains stubbornly elevated. Difficulties, especially in Greece, but potentially elsewhere, recall the European periphery crisis. Greek political troubles erupted again, with a crucial election being held in late January 2015. Greece’s leading left-wing opposition party has a significant chance of winning that contest. That party wants to renegotiate and reduce the nation’s monstrous debt. Will it continue reforms of the economy and state administration desired by creditors? At times, though less so recently, this leftist group has displayed some hostility to the country’s remaining in the Euro FX circle.

Despite the Eurozone’s noble struggle to create adequate inflation (avoid deflation), its success on that front probably will be limited. Inflation and long term government interest rates in key nations such as Germany probably will not sustain substantial increases even if the ECB races down the path of massive money printing via buying of government debt securities. Keep in mind Japan’s history. The United States still falls short of the Federal Reserve’s inflation target despite sustained massive easing. Remember as well America’s experience after it ceased (or steadily “tapered”) quantitative easing rounds; the 10 year United States Treasury note yield declined.

In recent months, the Euro FX has weakened, both against the United States dollar and on an effective exchange rate basis. This currency relationship and bear trend will continue. Nowadays, part of the ECB’s inexorable determination to “do what we must” pursuant to its interpretation of its mandate involves a willingness to let the Euro FX slump. In any event, even if massive ECB money printing and currency feebleness manage to achieve an inflation goal (and higher interest rates), they likely will not generate enduring significant Eurozone economic growth.

FOLLOW THE LINK BELOW to download this article as a PDF file.
Do What We Must- Eurozone Theatrics (1-3-15)
MARKETPLACE ENTANGLEMENTS: REVISITING 2008 © Leo Haviland December 14, 2014

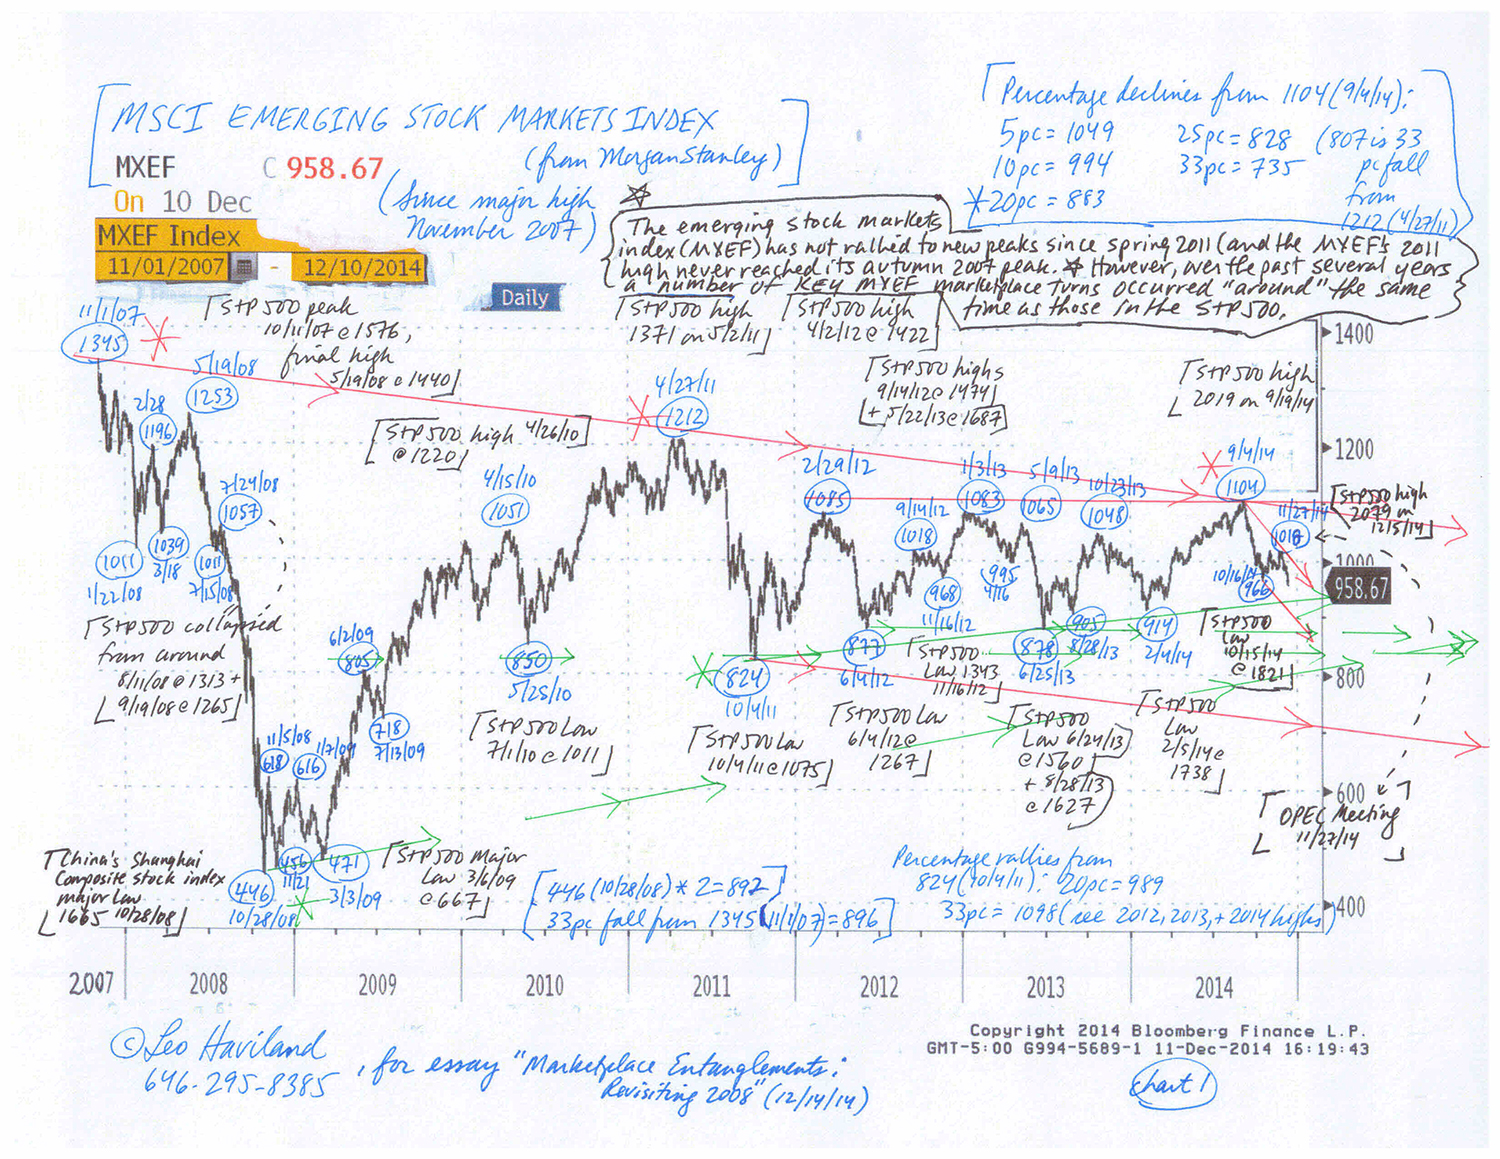
Focus on the current scene for and apparent relationships between the United States Treasury 10 year note, the S+P 500, emerging stock marketplaces (“MXEF”; MSCI Emerging Stock Markets Index, from Morgan Stanley), the United States dollar, and commodities in general (“GSCI”; broad Goldman Sachs Commodity Index). Surely much has changed since the dreadful days of the worldwide economic disaster that emerged in 2007 and accelerated during 2008. One critical difference involves the extraordinary sustained monetary accommodation (notably yield repression and money printing) by the US Federal Reserve Board and its central bank allies in response to the 2007-2009 crisis. Yet arguably many significant debt and leverage problems that developed during the wonderful Goldilocks Era never were solved, merely patched up, downplayed with sunny rhetoric, or postponed. Also, arguably, new debt and leverage problems, partly motivated by the ravenous hunt for yield (return), have walked on the financial stage.

The present marketplace panorama rather closely resembles that of 2008 in many respects. However, the S+P 500 has not yet slumped significantly from its recent high on 12/5/14 at 2079. A notable fall in the S+P 500 from that level nevertheless probably will occur, underscoring (further creating) the parallel with the 2007-08 situation. If the S+P 500 surpasses its December 2014 high, it likely will not do so by much anytime soon. In any event, assuming the major trends underway for these other marketplaces essentially remain intact, the S+P 500 likely will fall significantly, although probably not nearly as dramatically as it did during the 2007-09 span.

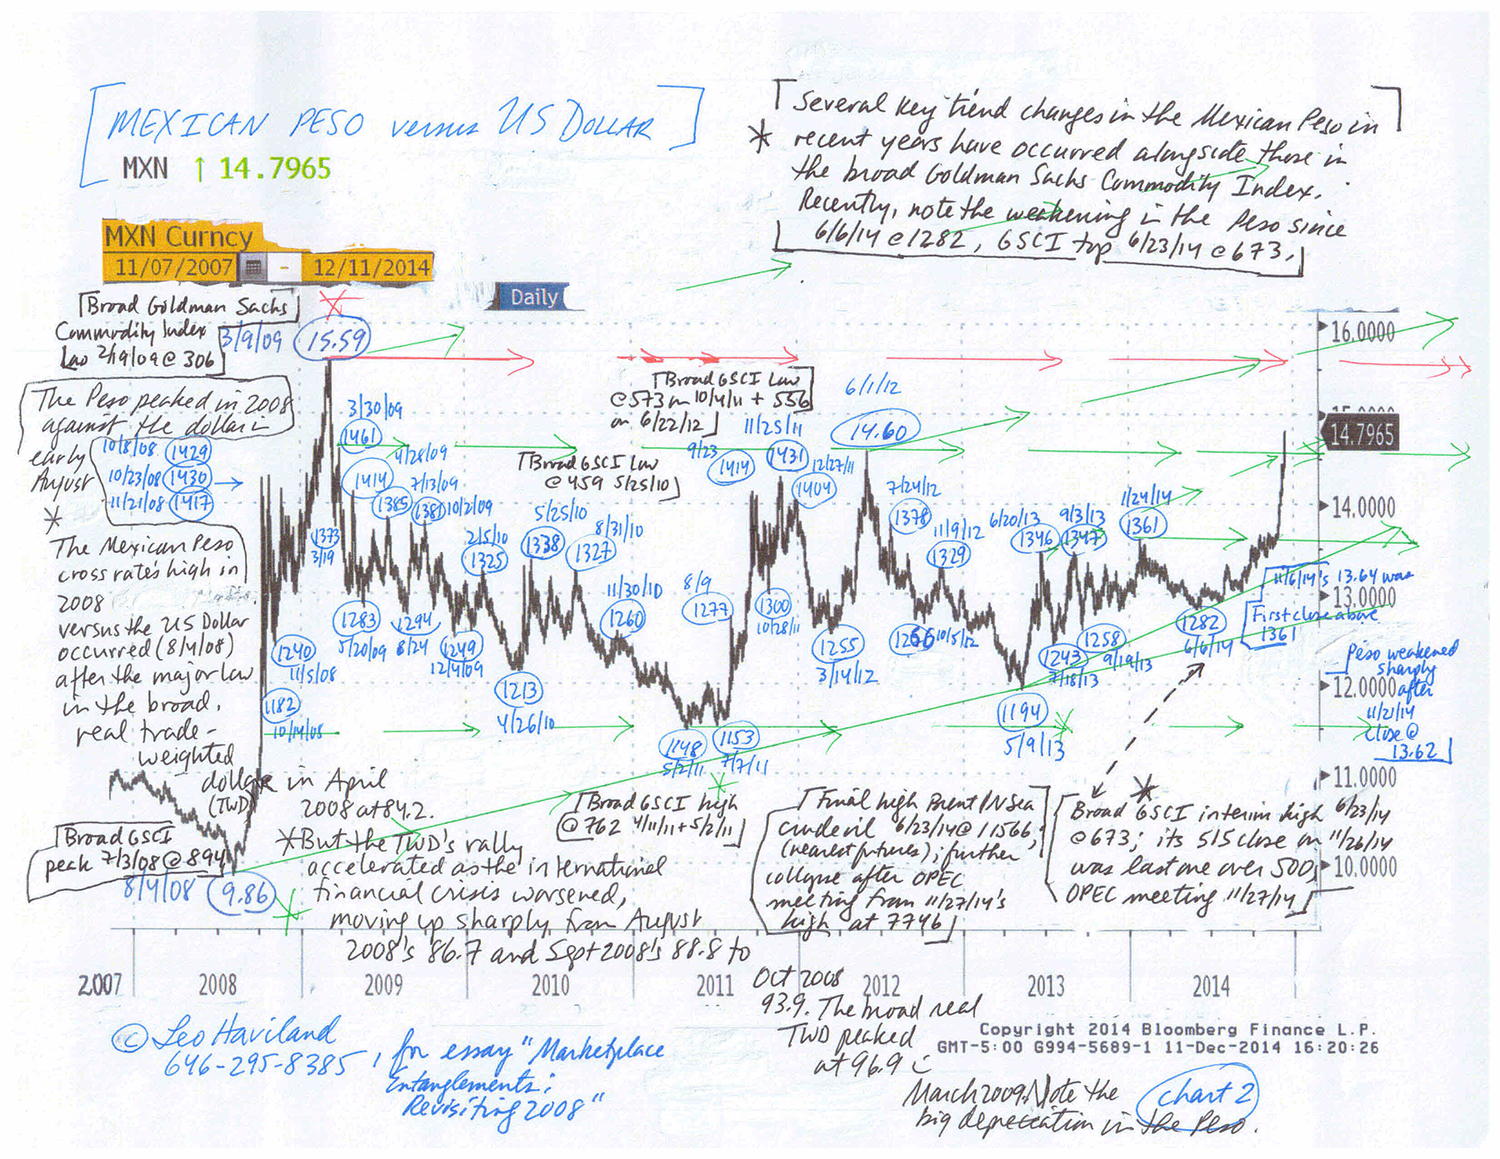
Although cross rates between the US dollar and other currencies are important, the level and trend of the broad real trade-weighted dollar (“TWD”) is a better benchmark for overall dollar strength and weakness.

The broad real TWD created a major low around 80.5 in July 2011. After moving to around 83.5 in September 2011, it meandered sideways for nearly three years, with June 2012’s 86.3 the high during that span.

From about 84.8 in July 2014, it began to edge steadily up (recall the related timing of the UST’s 7/3/14 interim high at 2.69pc and the GSCI’s 6/23/14 high). However, in September 2014, the TWD reached 86.6, thus breaching its June 2012 interim top; for this September 2014 TWD level, keep in mind the MXEF’s top in early September 2014.

The TWD reached 87.6 in October 2014 and 89.0 in November 2014. Its November 2014 level thus edged over September 2008’s TWD bull move take-off point, thus further warning marketplace observers of parallels between current times and the 2007-09 global financial crisis. The stronger dollar, as in 2008, coincides with the bear move in the broad GSCI. Note the MXEF high on 11/27/14 at 1018.
Charts--Emerging-Marketplace-Stocks,-Mexican-Peso-(12-14-14,-for-essay-Marketplace-Entanglements--Revisiting-2008)-2
Charts--Emerging-Marketplace-Stocks,-Mexican-Peso-(12-14-14,-for-essay-Marketplace-Entanglements--Revisiting-2008)-1

FOLLOW THE LINK BELOW to download this article as a PDF file.
Marketplace Entanglements- Revisiting 2008 (12-14-14)
Charts- Emerging Marketplace Stocks, Mexican Peso (12-14-14, for essay Marketplace Entanglements- Revisiting 2008)

STEPPING HIGHER: UST TWO YEAR NOTE YIELDS © Leo Haviland September 21, 2014

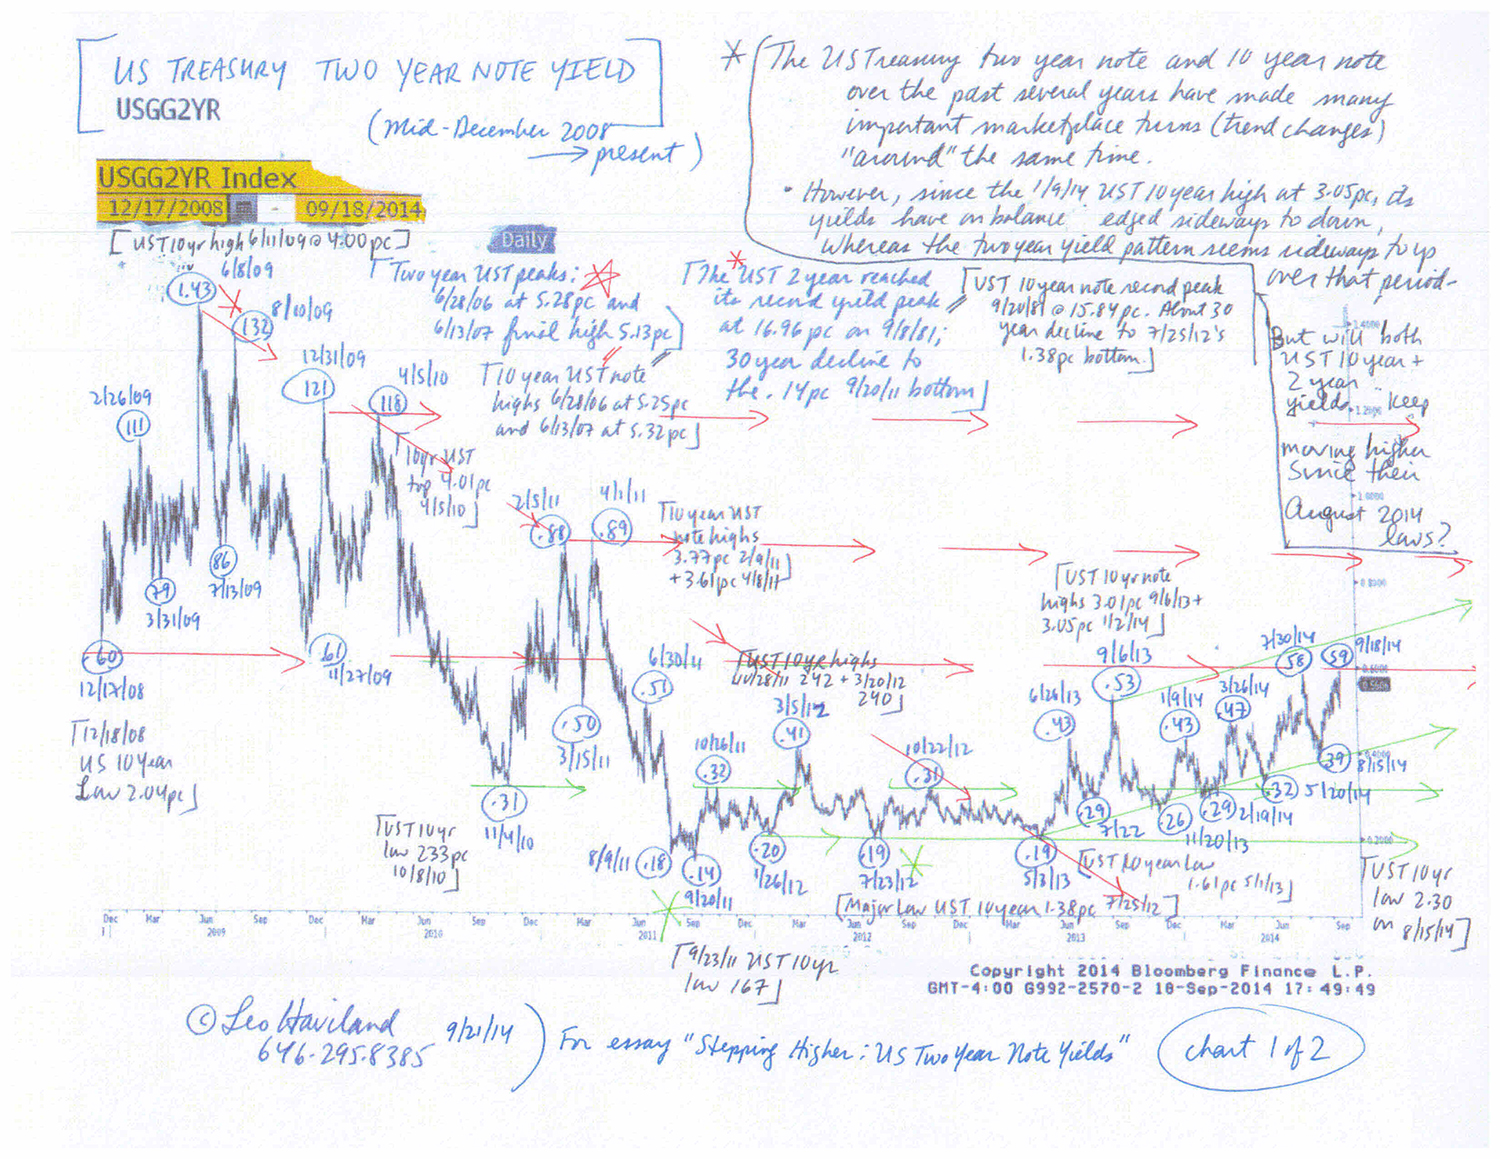
The US Treasury two year and 10 year notes over the past several years have made many important marketplace turns around the same time. The yield spread relationship between those instruments provides insight into and offers guidance regarding Federal Reserve policies. Although other variables of course are relevant, this spread offers indications regarding the extent of American (and international) economic strength or weakness.

Important trend moves in the 10 year less two year United States government yield spread often have roughly coincided with significant Federal Reserve Board policy decisions (sometimes assisted by major ones by the European Central Bank and others). Especially since around the time of its mid-December 2008 low around 125 basis points (10 year yield higher than two year; a positive yield curve), and thus during the Fed’s yield repression and quantitative easing era, the 10 year less two year spread has tended to widen (become more positive) during times of US economic growth (or notable signs or hopes for it) and decline during times where economic expansion slows or slumps (or when fears rise that this will occur). Fed quantitative easing moves link up with a widening of the yield spread (particularly via boosting the 10 year UST yield). The ending of the Fed’s money printing ventures have tied to narrowing of the yield spread (especially via falls in the UST 10 year yield). A narrowing pattern in this spread and the UST 10 year itself after the ending of QE (including the current tapering round) suggests that noteworthy “underlying” weakness remains in the US economy. See “Bond Yield Perspectives: Easing Comes: Easing Goes” (9/1/14) and related essays.

However, since the UST 10 year’s 1/9/14 plateau at 3.05pc, its yields on balance have moved sideways to down, whereas the two year yield pattern seems sideways to up over that period. The slip in the 10 year yield since then, given the Fed’s determination to increase inflation, indicates less than robust US (worldwide) economic growth. The increase in two year yields may reflect Fed plans more than notable overall economic strength (or the Fed’s faith that such strength is or will soon emerge). Yet will yields for both UST notes keep moving higher since their mid-August 2014 lows?

From the depths of the international economic disaster through most of the succeeding years, these US Treasury yield curve ventures (trend changes) generally have occurred around the same time as significant moves not only in the US Treasury 10 year note but also in the US stock marketplace (S+P 500). Many lows in the 10/2 UST yield curve spread have tied up with (occurred within a few months of) important S+P 500 bottoms; pinnacles in the spread likewise connect somewhat closely in time with plateaus in the US stock landscape.

However, whereas the 10 less two year spread and the 10 year yield itself have declined in recent months (265 basis point high in the yield spread 12/31/13; 3.05pc high on 1/2/14 for the UST 10 year), the S+P 500 this year has ascended to new highs over 2000. Thus the S+P 500’s relationship relative to the 10 less two year spread and the UST 10 year itself seems to have diverged from its prior pattern.

Significantly, the rise in two year note yields since very late 2013/early 2014 contrasts with the fall in the UST 10 year yield and the narrowing of the 10 less two year spread. Since end December 2008, roughly simultaneous declines in the 10 year note yield and the 10 less two year UST spread have been associated with a relatively weak US economic situation (or fears that such feebleness will emerge; international players such as the Eurozone affect this picture).

This slide in the 10 year note and the 10 less two year UST spread connects with the end of Federal Reserve money printing festivals, including the current one. Thus the US may be economically weaker (or more vulnerable to such feebleness) than many marketplace players or even the Fed (judging from its Fed Funds projections) perceives.

Emerging stock marketplaces have not followed the S+P 500 up to record highs. Given the slowing of economic growth in those economies, this represents a warning that the massive bull move in the S+P 500 may not continue forever. Look at the “MSCI Emerging Stock Markets Index” (from Morgan Stanley: MXEF). The MXEF over the past year or so has advanced from lows near in time to those in the S+P 500. Note the MXEF troughs at 878 on 6/25/13, 905 on 8/28/13, and 914 on 2/4/14. However, the MXEF remains below its Goldilocks Era pinnacle at 1345 (11/1/07), as well as 4/27/11’s 1212 plateau. In addition, it has started to fade from its recent top at 1104 on 9/4/14 (despite the ECB’s monetary easing action). If the MXEF starts to step significantly lower (keep an eye on 2/29/12’s high at 1085 and 1/3/13’s one at 1083), that will suggest increasing risks for the S+P 500 (especially if the UST 10 year yield also is unable to breach the 3.05pc level). Renewed weakness in emerging stock marketplaces increases the odds that the continued S+P rally will end (S+P 500 divergence from UST 10 year and 10 less two year trends will cease).

The S+P 500 eventually dropped after QE1 and QE2 ended. Since the current round of US quantitative easing will end in October 2014 (tapering of purchases will finally finish), one should be especially watchful for a reversal (even if it is modest) of the S+P 500’s epic bull trend.

Another sign of sluggish economic growth, particularly in emerging marketplaces, has been the decline in commodities “in general” since spring 2011 (broad Goldman Sachs Commodity Index/GSCI). The GSCI peaked at 762 on 4/11 and 5/2/11. Since then, it generally has displayed a pattern of declining (lower and lower) highs. It recently made an interim top around 673 on 6/23/14, slipping to 582 on 9/15/14.

Charts--Two-Year-UST,-10-Year-v-2-Year-UST-spread-(9-21-14,-for-essay-Stepping-Higher--UST-Two-Year-Note-Yields)-2

Charts--Two-Year-UST,-10-Year-v-2-Year-UST-spread-(9-21-14,-for-essay-Stepping-Higher--UST-Two-Year-Note-Yields)-1

FOLLOW THE LINK BELOW to download this article as a PDF file.
Stepping Higher- US Two Year Note Yields (9-21-14)
Charts- Two Year UST, 10 Year v 2 Year UST spread (9-21-14, for essay Stepping Higher- UST Two Year Note Yields)

BOND YIELD PERSPECTIVES: EASING COMES, EASING GOES © Leo Haviland September 1, 2014

The dreadful economic crisis which emerged throughout the interconnected global economy after the departure of the Goldilocks Era in mid-2007 saw its darkest times in late 2008/early 2009. Politicians and central bankers around the globe took decisive action to escape and repair the disaster and to spark and sustain recovery. From late 2008/early 2009 through the ensuing years, dramatic United States Federal Reserve policy action, and especially massive quantitative easing (money printing), often has been associated with rising interest rates in the ten year US Treasury note. The ending of quantitative easing has connected with declines in the 10 year UST yield.

In the American theater, the past several years indicate that rising UST 10 year yields tie in with the reality of (or hopes for) at least a moderate economic recovery. Slumping UST rates are bound to the existence of (or fears about) more feeble US (and international) growth (or even worries that a downturn may occur). History of course need not repeat itself, and viewpoints change. Nevertheless, and despite America’s strong 2Q14 GDP expansion, the decline in UST 10 year yields over the course of the Fed’s current slow tapering program suggests that US and worldwide economic growth probably is and will remain mediocre.

The European Central Bank probably will embark on a modest money printing adventure in the relatively near future. However, all else equal, that decision likely will boost- but not substantially- the key German sovereign 10 year note yield (and 10 year government note yields in America and many other key nations).
Read the rest of this entry »

FOLLOW THE LINK BELOW to download this article as a PDF file.
Bond Yield Perspectives- Easing Comes, Easing Goes (9-1-14)
Charts- Ten Year Notes (9-1-14, for essay Bond Yield Perspectives- Easing Comes, Easing Goes)