GLOBAL ECONOMICS AND POLITICS

Leo Haviland provides clients with original, provocative, cutting-edge fundamental supply/demand and technical research on major financial marketplaces and trends. He also offers independent consulting and risk management advice.

Haviland’s expertise is macro. He focuses on the intertwining of equity, debt, currency, and commodity arenas, including the political players, regulatory approaches, social factors, and rhetoric that affect them. In a changing and dynamic global economy, Haviland’s mission remains constant – to give timely, value-added marketplace insights and foresights.

Leo Haviland has three decades of experience in the Wall Street trading environment. He has worked for Goldman Sachs, Sempra Energy Trading, and other institutions. In his research and sales career in stock, interest rate, foreign exchange, and commodity battlefields, he has dealt with numerous and diverse financial institutions and individuals. Haviland is a graduate of the University of Chicago (Phi Beta Kappa) and the Cornell Law School.


Subscribe to Leo Haviland’s BLOG to receive updates and new marketplace essays.

RSS View Leo Haviland's LinkedIn profile View Leo Haviland’s profile



COMMODITIES AND US STOCKS: CONVERGENCE AND DIVERGENCE © Leo Haviland January 28, 2013

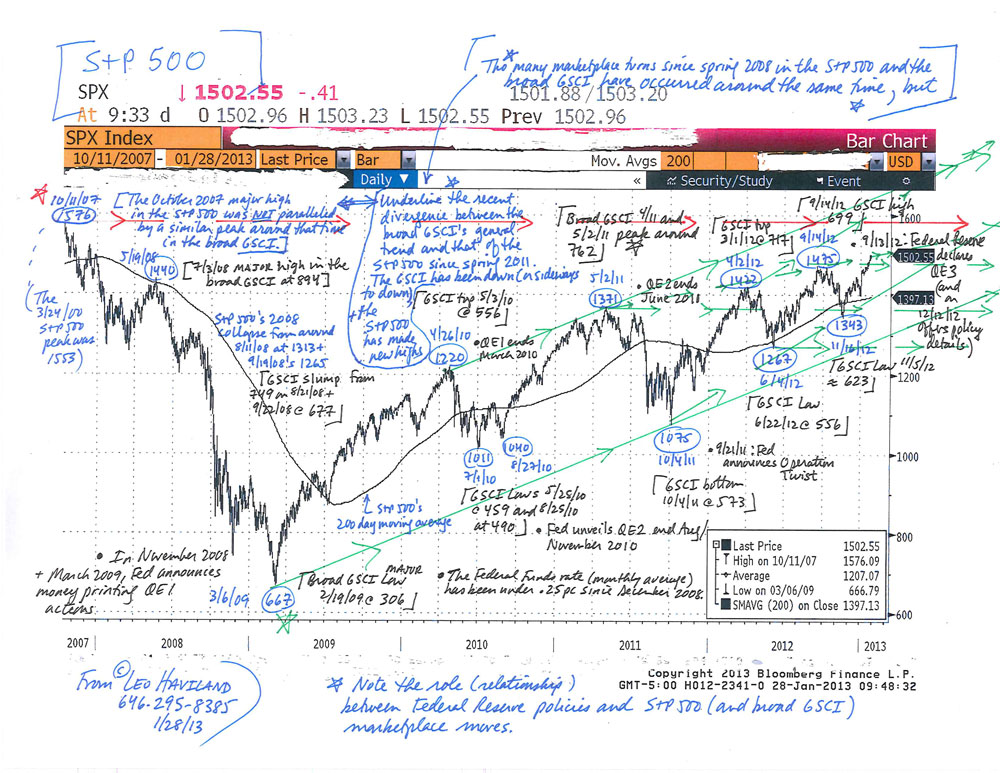
Since mid-2008, commodities “in general” and United States stocks “as a whole” have moved roughly in the same direction at around the same time. In this convergence process (relationship), noteworthy bull (bear) moves in US equities find parallels in those in the commodity arena. Thus significant marketplace rallies (declines) have tended to occur around the same time.

However, this perspective is not the only vantage point by which to assess the often close relationship between US equities and the commodities complex. There also is another, longer run view by which one can examine the relationship between them. Since spring 2011, commodities have ventured down (or sideways to down). However, key American stock benchmarks such as the S+P 500 have attained new highs, first in April 2012, then September 2012, and again in January 2013. Thus despite the convergence at assorted timely turning points since spring/ summer 2008, and even though the two territories continue to trade together to some extent, arguably there has been noteworthy divergence in their overall relationships (their trends) since May 2011.

Now recall several of 2007-08’s details. US equities peaked in October 2007, almost nine months before the commodity one in early summer 2008. Only after the final stock marketplace

summit in May 2008 did equities and commodities trade in close tandem. The current longer run relationship thus perhaps likewise reveals divergence, but with the commodity peak to date appearing well before any major S+P 500 one.

In contrast to 2007-08, what if the major peak in commodities is well before that in stocks (and the lag is likewise so great as to suggest divergence)? Suppose- and this admittedly is a key suppose- eventually commodities and US stocks will trade together over the long run. After all, so-called marketplace relationships can change dramatically, whether from the convergence/ divergence (lead/lag) perspective or otherwise. What does continued divergence, the failure of commodities to near or exceed its spring 2011 heights, suggest?

The 2007-08 relationship warns that the current continued failure of commodities to confirm the equity rally eventually will reveal a notable decline in stocks. Since the duration between the spring 2011 commodities top and today’s new highs in the S+P 500 is almost 20 months, whereas that between October 2007’s stock pinnacle and the broad GSCI’s summit in July 2008 was about nine months, the failure of the broad GSCI to achieve new heights should warn equity bulls that a decline may be fairly near in time.
S+P-500-Chart-(1-28-13,-for-essay-on-Commodities-and-US-Stocks)

FOLLOW THE LINK BELOW to download this market essay as a PDF file.
Commodities and US Stocks- Convergence and Divergence (1-28-13)
S+P 500 Chart (1-28-13, for essay on Commodities and US Stocks)
AMERICAN YIELD QUESTS: US TREASURY AND CORPORATE RATES (c) Leo Haviland, December 20, 2012

For several years, in response to the terrifying ongoing international economic crisis, the Federal Reserve Board, European Central Bank, and many other key central banks have played Santa Claus to the global economy in general and debtors (borrowers) in particular. Suppose marketplace stargazers scan the constellation of accommodative Fed policies. These include the blessings of ground level interest rates (Federal Funds) and three sparkling rounds of money printing. The Fed joyously promises to continue offering its bountiful gifts for quite some time!

Not to be outdone, American and other politicians chattering and sometimes laboring in their workshops, engage in massive deficit spending designed to launch and preserve economic recovery.

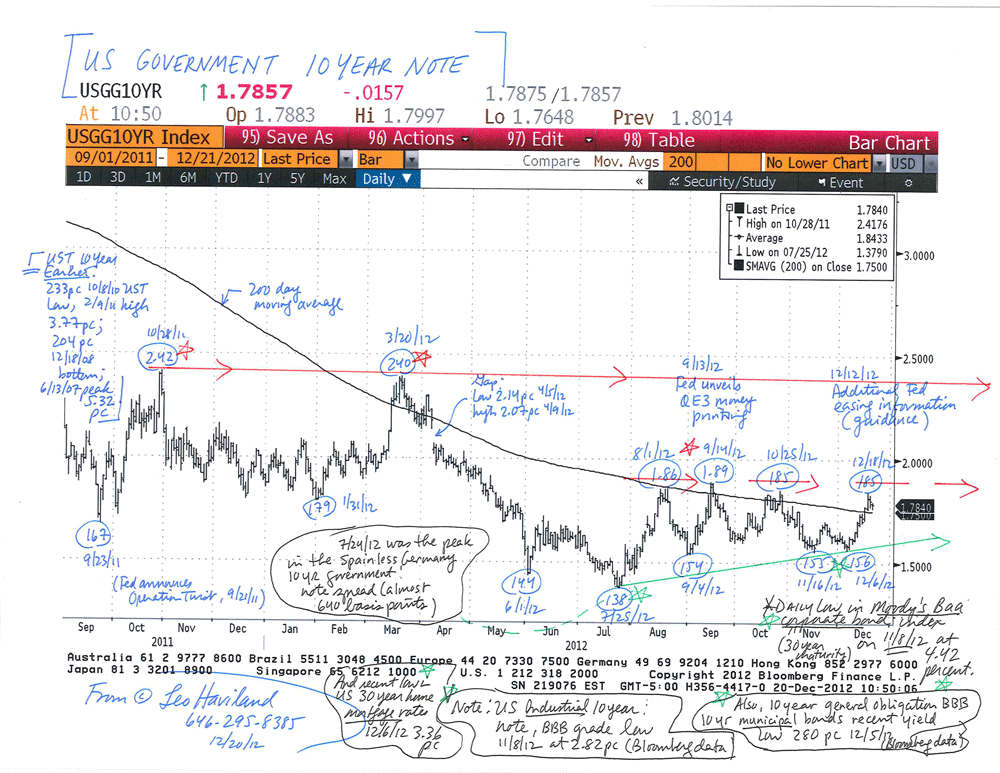
In any event, the UST 10 year note established a major bottom several months ago, at 1.38 percent on 7/25/12. Note that on 12/12/12 the beneficent Federal Reserve not only reaffirmed its two percent long run inflation target, but also indicated it would tolerate inflation projections of 2.5pc for up to two years ahead. Ascending UST rates suggest that the US corporate realm likewise in general will have higher rates.

Take Moody’s Baa index of bonds as a benchmark for US lower quality corporate bonds, yet nevertheless “investment grade”.

Based upon this Baa corporate signpost, US lower quality corporate bond rates have been creeping up lately. They probably established a very significant trough around 4.5 percent in November 2012, or will do so soon. Using daily data (and the extra decimal point) that bottom was 4.42 percent on 11/8/12 (12/18/12 close 4.76pc).

In the US credit arena nowadays, a widening yield spread between lower quality corporate debt and UST might reflect that the hunt for better yields beyond the UST field probably has reached an end.

US-Treasury-10-Year-Note-Chart-(12-20-12)


FOLLOW THE LINK BELOW to download this market essay as a PDF file.

American Yield Quests- US Treasury and Corporate Rates (12-20-12)

US Treasury 10 Year Note Chart (12-20-12)

ECONOMIC AND POLITICAL LINES (c) Leo Haviland October 22, 2012

Highlight two International Monetary Fund comments in its recently unveiled “Fiscal Monitor” (October 2012). “With downside risks in the global economy mounting, policymakers must once again tread the narrow path that will permit them to continue strengthening the public finances while avoiding an excessive withdrawal of fiscal support for a still-fragile economic recovery.” (page ix). And: “In most advanced economies, the near-term fiscal stance has to walk the fine line between continued adjustment and supporting the economy.” (p6).

This IMF rhetoric, which many other luminaries embrace, of “tread the narrow path” and “walk the fine line” offers hope for the global economy and for the United States in particular. Maybe subtle financial and political sorcerers somehow can escape the dilemma of an economic downturn (too slow growth or recession) and the consequences of additional (irresponsible) substantial deficit spending! Have faith that wise guardians can discover a middle way to evade further suffering!

In the amazing Goldilocks Era, didn’t substantial and growing worldwide debt and leverage joyously promise and provide nearly limitless opportunity for almost everyone (“us”) to prosper with very little (or at least manageable) risk? In the aftermath of the wonderful Goldilocks epoch, should we believe that the implications of significant leverage and mountainous debt accumulation can be magically pain-free, at least over some misty medium term or long run vista?

Despite such entrancing sermons of narrow paths and fine lines from many respected central banking and political guides, economic and political pilgrims should ask if such a path or line exists in practice. It probably doesn’t. Is there really a way for the United States to avoid the looming fiscal cliff and other long run deficit challenges without significant hardship? Probably not.

Most observers are not focusing closely on the potential composition of the Senate. They should. The Senate election result probably will have notable consequences for legislative action (or inaction) in many domains. For example, think of the troubling fiscal cliff and the terrifying long run deficit problems.

Clairvoyants on balance believe the Democrats probably will maintain control of the Senate. Even if the Republicans gain an edge in the Senate, it would be very surprising for them to capture anything close to 60 seats. According to Senate rules, to end debate (halt filibusters) on a legislative proposal (bill), 60 of the 100 Senators must agree to do so (invoke cloture). The sixty votes do not have to all be from the same party. Nevertheless, the failure of a Senate majority party to control 60 or more Senate seats means that its opponents generally can block the majority party’s legislative efforts.

So suppose the House is Republican, and the Senate is Democratic (or even imagine a modest Republican majority). Given such Congressional division, it will be a major challenge for the parties to readily resolve issues over which they disagree dramatically, such as on how to repair the federal deficit disaster. In that situation, the party membership of the winner of the duel for the Presidency matters much less. After all, for the past several years, the Republican House and the Democratic Senate stubbornly have faced each other. With these battle lines, there has been at best little progress on reducing the deficit. Why should having a Republican President instead of a Democratic one change this partisan deadlock in any notable fashion?

FOLLOW THE LINK BELOW to download this market essay as a PDF file.
Economic and Political Lines (10-22-12)
Chart- Commodities- Broad GSCI (10-22-12)

FED FIXATIONS: INTEREST RATES © Leo Haviland September 24, 2012

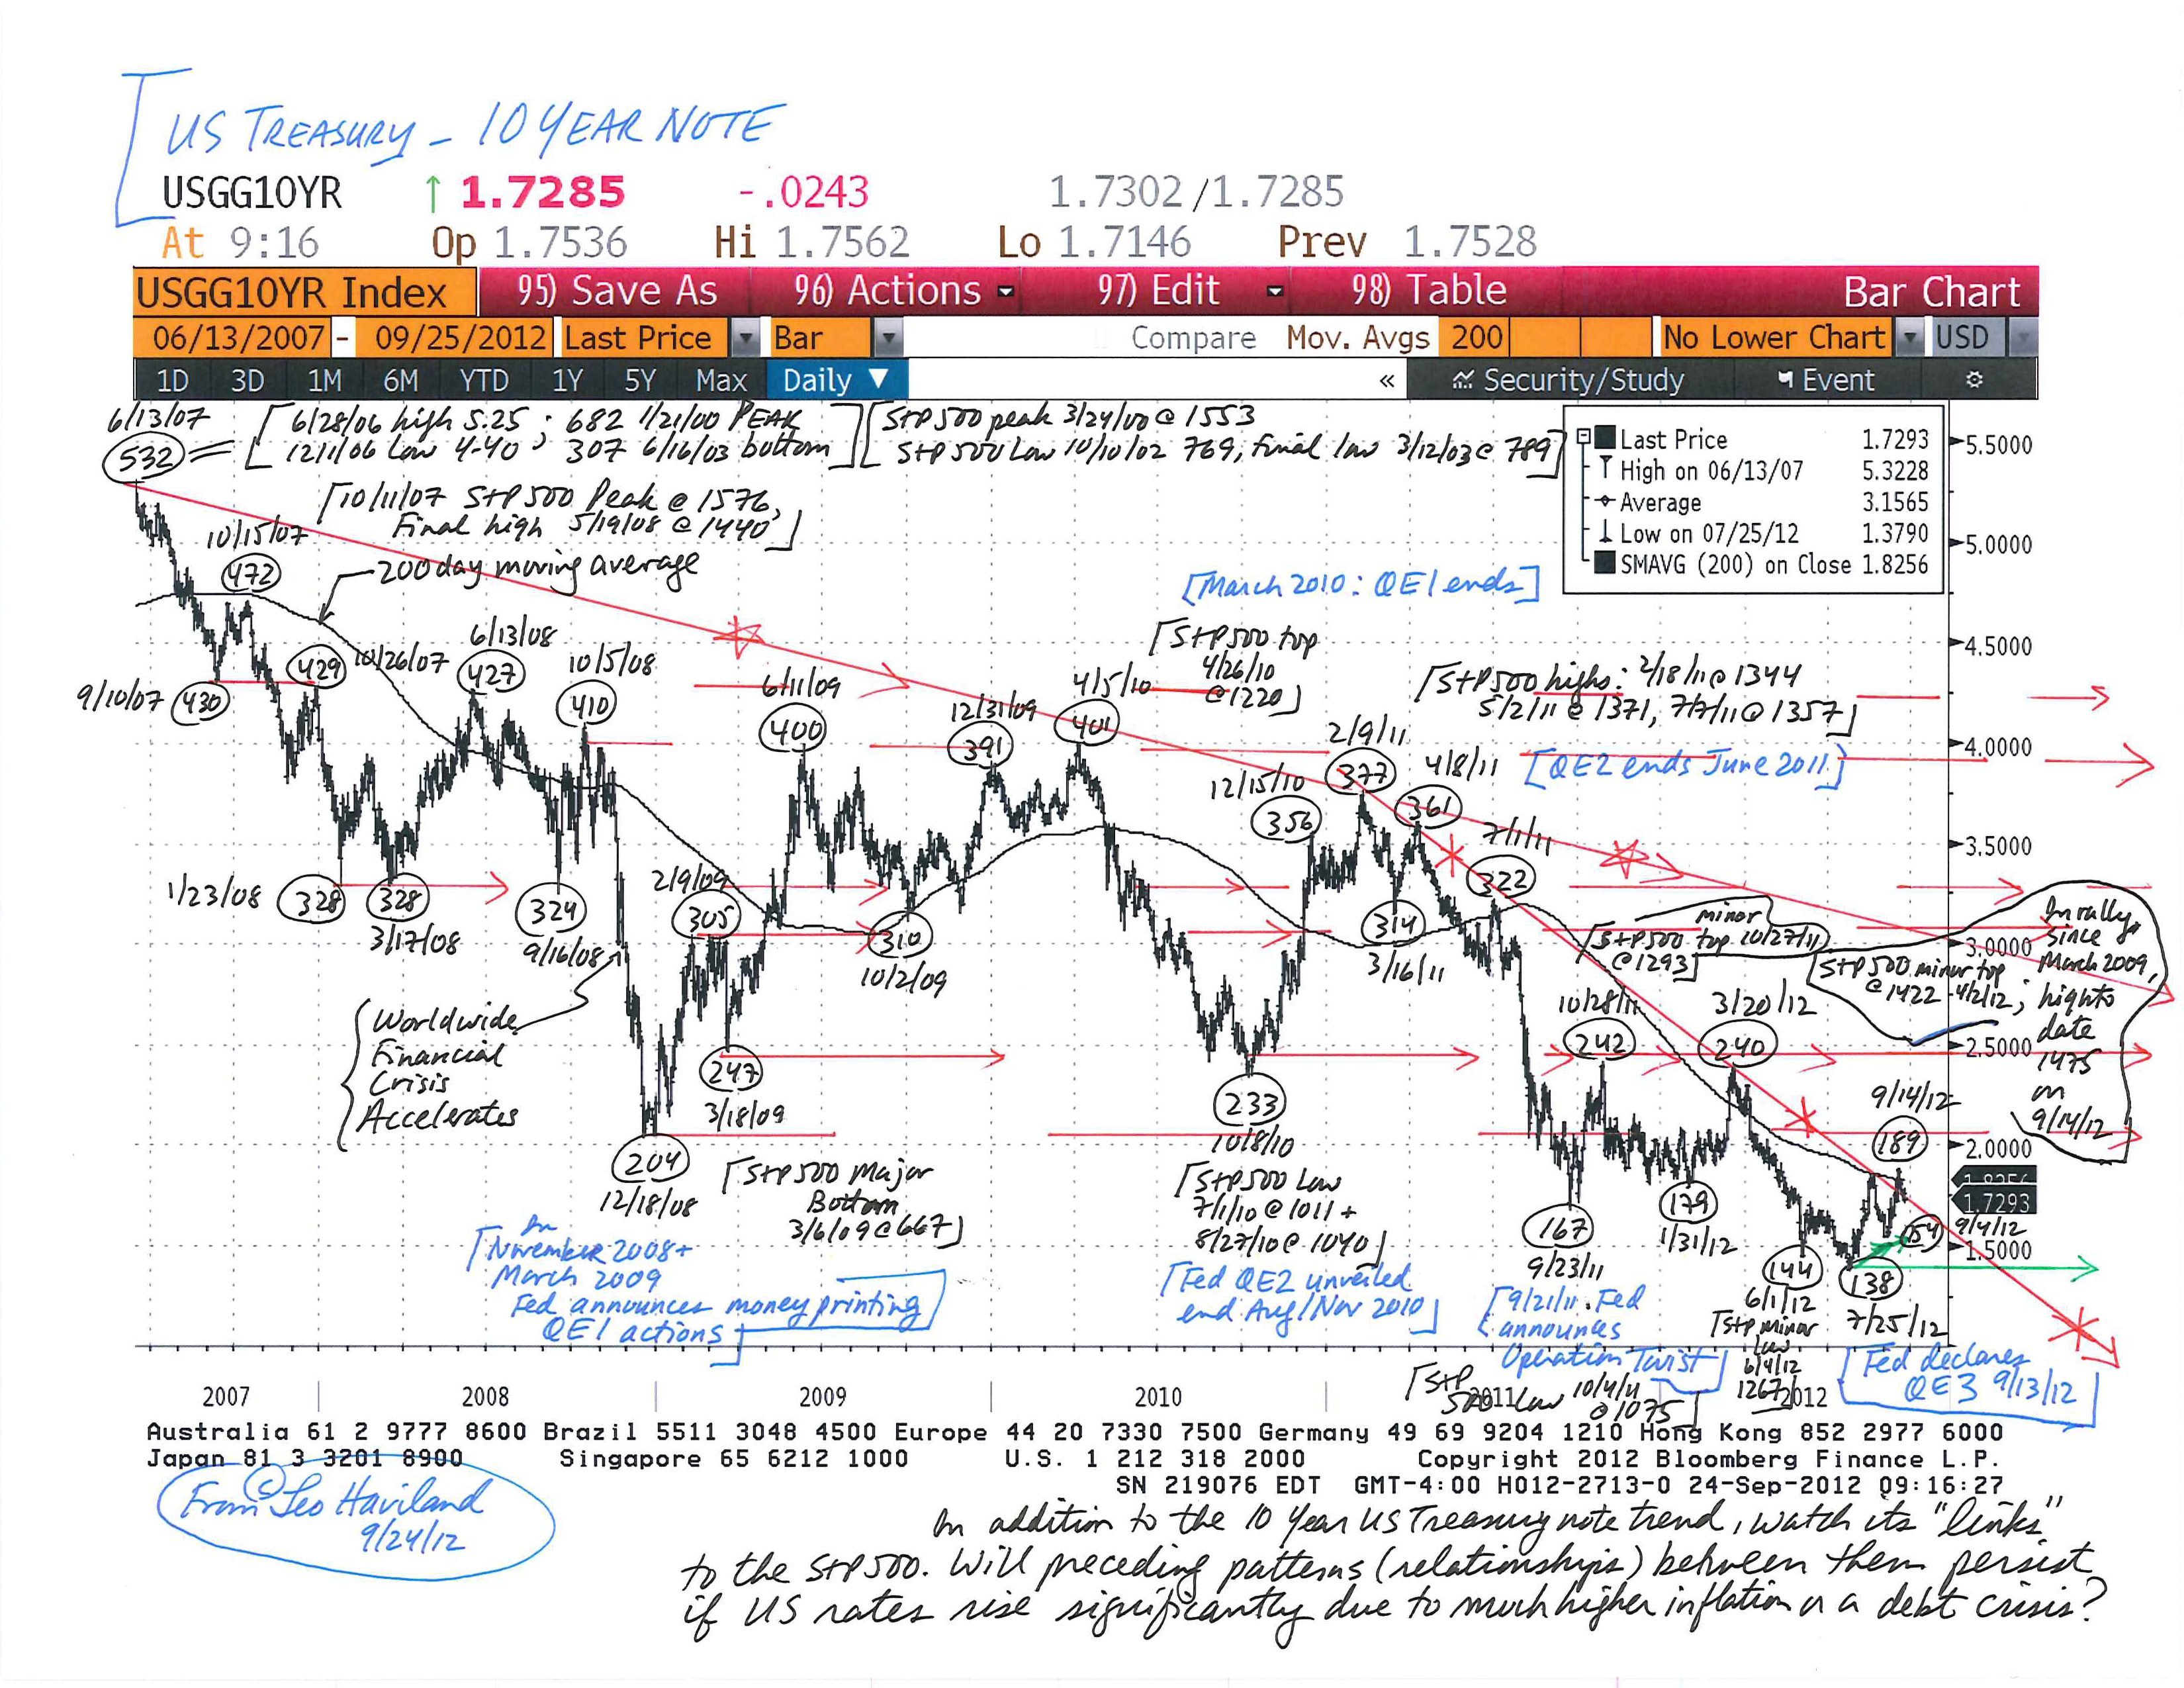
A key United States interest rate benchmark, the 10 year Treasury note, probably established a major bottom around 1.40 percent in late July 2012.

The Federal Reserve Board’s fixing of the Federal Funds rate at exceptionally low levels admittedly restrains ascents in US government yields. Its benevolent promise and determination to maintain the Funds rate almost flat on the ground until at least mid-2015 encourages faith that government yields generally will remain depressed. Also, heightened flight to quality fears and nervous leaps in recessionary worries may push the 10 year UST challenge back toward or even slightly beneath its July low. The Eurozone crisis, for example, has not disappeared. America’s 2013 federal “fiscal cliff” looms large on the horizon.

However, all else equal, a flood of money printing tends to increase inflation and thus interest rates. And all else equal, cracking or crumbling creditworthiness for a borrower- whether an individual, corporation, or government- tends to boost the interest rate charged that borrower. America nowadays confronts another round of Federal Reserve money printing and has made little headway in resolving its awesome fiscal problems.

The Federal Reserve’s long rumored (fervently hoped for) and recently decreed (9/13/12) third cascade of money printing, QE3, probably will be massive, perhaps over one trillion dollars. Over time, this deluge will help to boost US government (and other) interest rates.

Moreover, given a generous desire to avoid the fiscal cliff and a downturn, Congress probably will continue its huge deficit spending spree. Not only has America become habituated to deficit spending, debt (including personal debt), and assorted forms of entitlement. How many people volunteer nowadays to pay sufficiently more taxes to solve- or at least significantly reduce- near term (as well as long run) national fiscal troubles? For a debtor nation such as America, running substantial budget deficits alongside elevated (and thus expanding) government debt as a percentage of nominal GDP raises the risk of a severe fiscal trial. The arrival of this crisis probably will occur relatively soon rather than at some vague date many years down the road. In any event, this visit will tend to raise US government rates. The US may be an economic fortress, but that does not guarantee that its creditworthiness will be unquestioned or unchallenged. Witness Europe in recent years; also recollect the debt sagas of many emerging marketplaces.

What are key levels for the US Treasury 10 year note? Start at the low end and walk higher.

FOLLOW THE LINK BELOW to download this market essay as a PDF file.
Fed Fixations- Interest Rates (9-24-12)
US Treasury 10 Year Note Chart (9-24-12)