GLOBAL ECONOMICS AND POLITICS
Leo Haviland provides clients with original, provocative, cutting-edge fundamental supply/demand and technical research on major financial marketplaces and trends. He also offers independent consulting and risk management advice.
Haviland’s expertise is macro. He focuses on the intertwining of equity, debt, currency, and commodity arenas, including the political players, regulatory approaches, social factors, and rhetoric that affect them. In a changing and dynamic global economy, Haviland’s mission remains constant – to give timely, value-added marketplace insights and foresights.
Leo Haviland has three decades of experience in the Wall Street trading environment. He has worked for Goldman Sachs, Sempra Energy Trading, and other institutions. In his research and sales career in stock, interest rate, foreign exchange, and commodity battlefields, he has dealt with numerous and diverse financial institutions and individuals. Haviland is a graduate of the University of Chicago (Phi Beta Kappa) and the Cornell Law School.
Subscribe to Leo Haviland’s BLOG to receive updates and new marketplace essays.

Assume normal weather and moderate United States economic growth. Then natural gas inventories in the US Eastern Consuming Region at the end of the 2014 build season probably will range between 1825bcf and 1930bcf. Around 2050bcf is about “normal” (average) for current United States supply and demand patterns. This current bullish inventory picture for the Eastern Consuming Region for the balance of build season parallels the bullish stock outlook of the US Producing Region.
Within the American natural gas scene, Producing Region and Eastern Consuming Region inventories have bigger marketplace shares than that of the Western Consuming Region. Is the Western Consuming Region’s inventory situation for build season 2014 bullish or bearish? The Energy Information forecasts that Western inventories will exceed 560bcf, a bearish perspective relative to that region’s 511bcf end build season average. However, the EIA probably overstates the likely amount of Western inventory building. Not only did Western stocks finish winter 2013-14 draw season at very low levels. Based on historical analysis of builds following comparable low starting totals, Western end build season inventories probably will be around 450bcf to 500bcf. This outcome is slightly bullish.
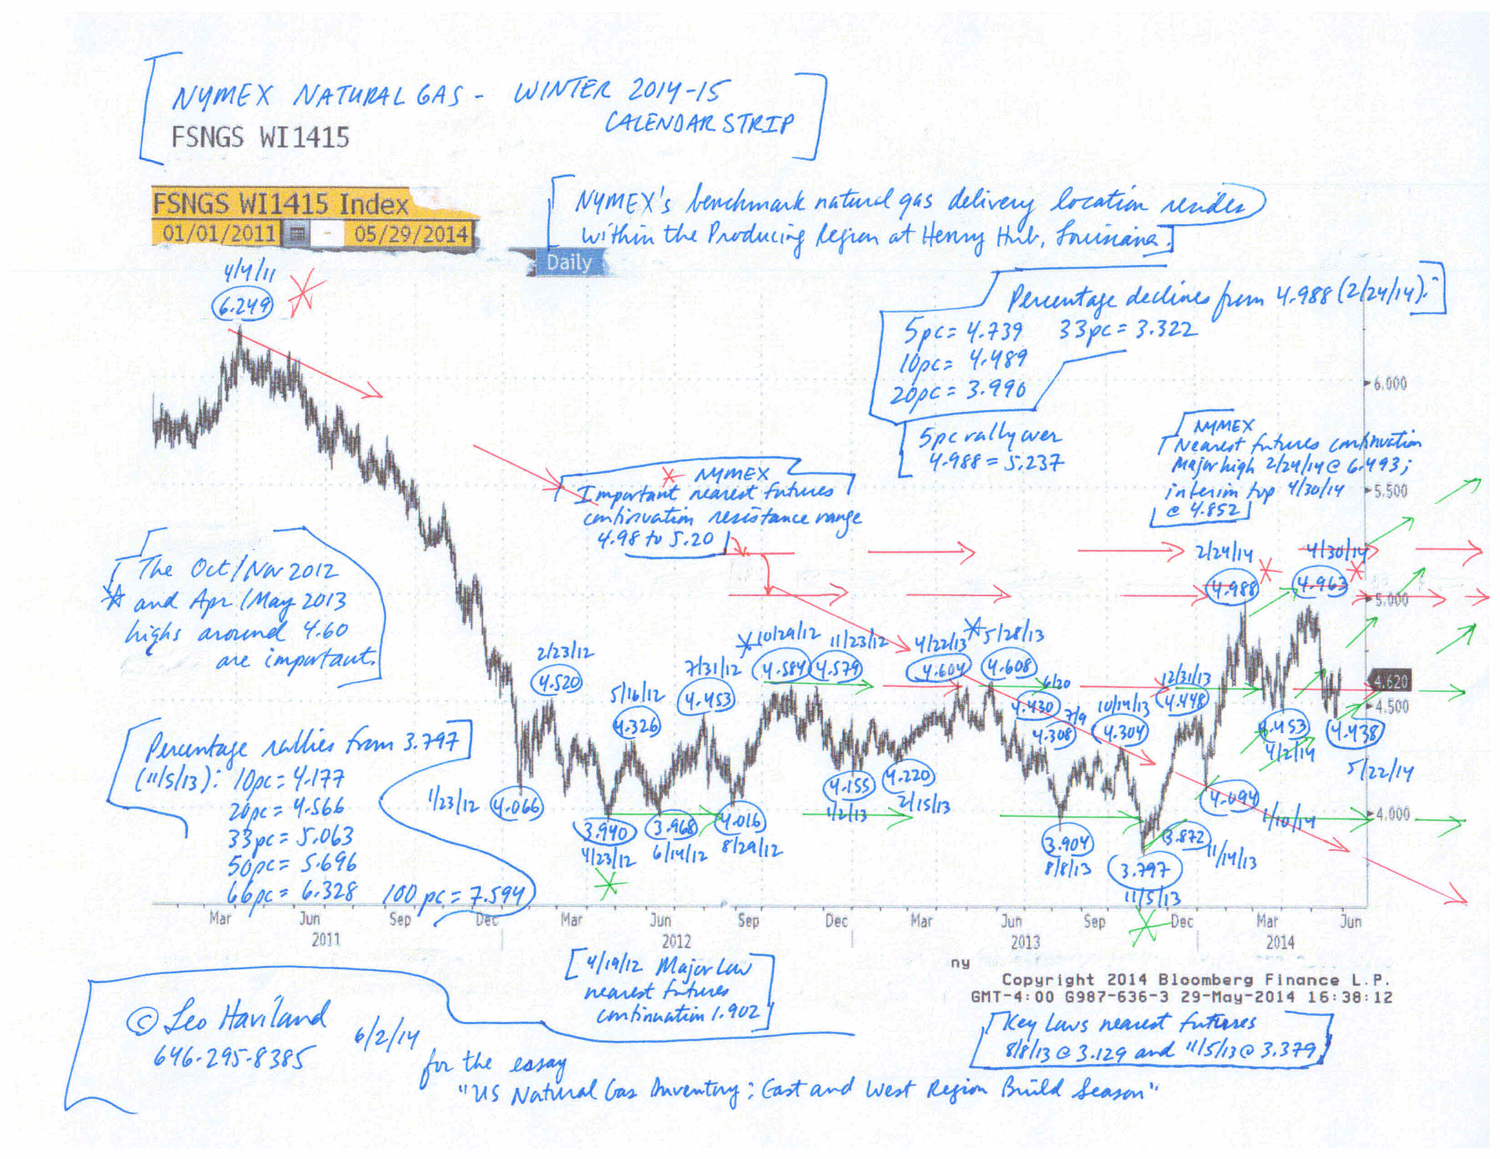
Despite the sharp price slump in NYMEX natural gas nearest futures continuation after its 2/24/14 peak at 6.493, the overall US inventory situation for the balance of 2014 build season remains bullish. The NYMEX natural gas complex during the course of build season probably will remain in a sideways trend. The NYMEX nearest futures contract probably will stay in a range from 3.80 /4.00 to 5.00/5.20. See “US Natural Gas Inventory Building: the Producing Region Picture” (5/18/14) for price forecast and Producing Region inventory details.

FOLLOW THE LINK BELOW to download this article as a PDF file.
Natural Gas Inventory- East and West Region Build Season (6-2-14)
Chart- NYMEX natural gas winter 2014-15 strip (6-2-14, for essay US Natural Gas Inventory- East and West Region Build Season)
When United States natural gas 2014 build season ends this autumn, assuming normal weather and moderate US economic growth, working gas inventories in the key Producing Region probably will be between 1030bcf/1056bcf and 1170bcf. Suppose US gas output over the next several months significantly exceeds the Energy Information Administration’s May 2014 forecast (as some natural gas clairvoyants claim it will). Then inventories may ascend from the EIA’s current estimate of over 1020bcf to around 1170bcf. Based upon historic inventory patterns, especially those of 2006 to the present, most marketplace participants probably view around 1173bcf as average Producing Region inventory for the end of build season. Historical analysis indicates that a move to around 1232bcf, though unlikely, should not be discounted. In any event, the Producing Region probably will not face containment problems this year.
The NYMEX natural gas marketplace during the course of build season probably will remain in a sideways trend, with the range being 3.80/4.00 to 5.00/5.20 (nearest futures continuation). The spring 2013 top (5/1/13 at 4.444) represents a midpoint to monitor. Despite the bearish price drop since late February 2014, the current Producing Region and overall US inventory picture for the balance of build season still appears quite bullish. What happens if as build season marches onward, actual overall US inventories look unable to increase significantly relative to the EIA’s May 2014 prediction for end build season 2014? Then a breakout above 5.00/5.20 resistance is probable. Suppose Producing Region inventory looked headed toward around 1230bcf, and that a comparable large percentage inventory gain also appeared likely in the Eastern and Western regions. Then a price move toward 3.40 may occur.
Read the rest of this entry »
FOLLOW THE LINK BELOW to download this article as a PDF file.
US Natural Gas Inventory Building- the Producing Region Picture (5-18-14)
Charts- NYMEX natural gas and coal (5-18-14, for essay US Natural Gas Inventory Building- the Producing Region Picture)
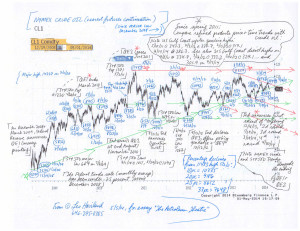
The worldwide petroleum marketplace “in general” will continue its sideways to down trend.
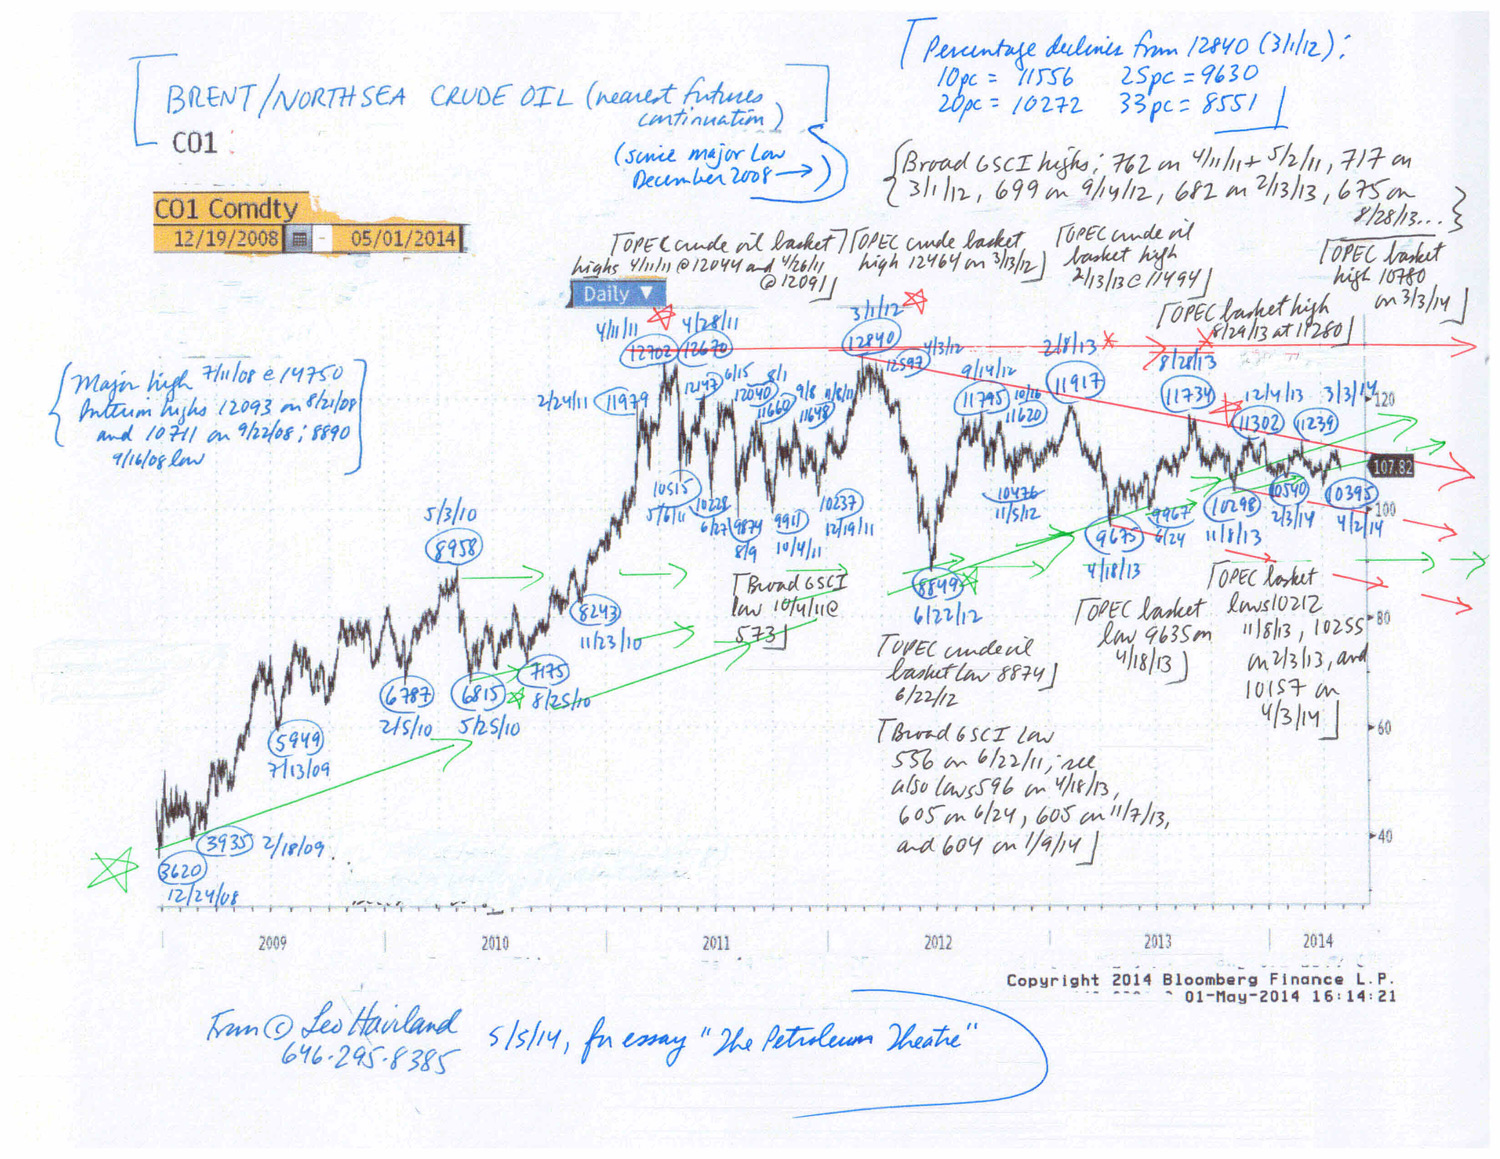
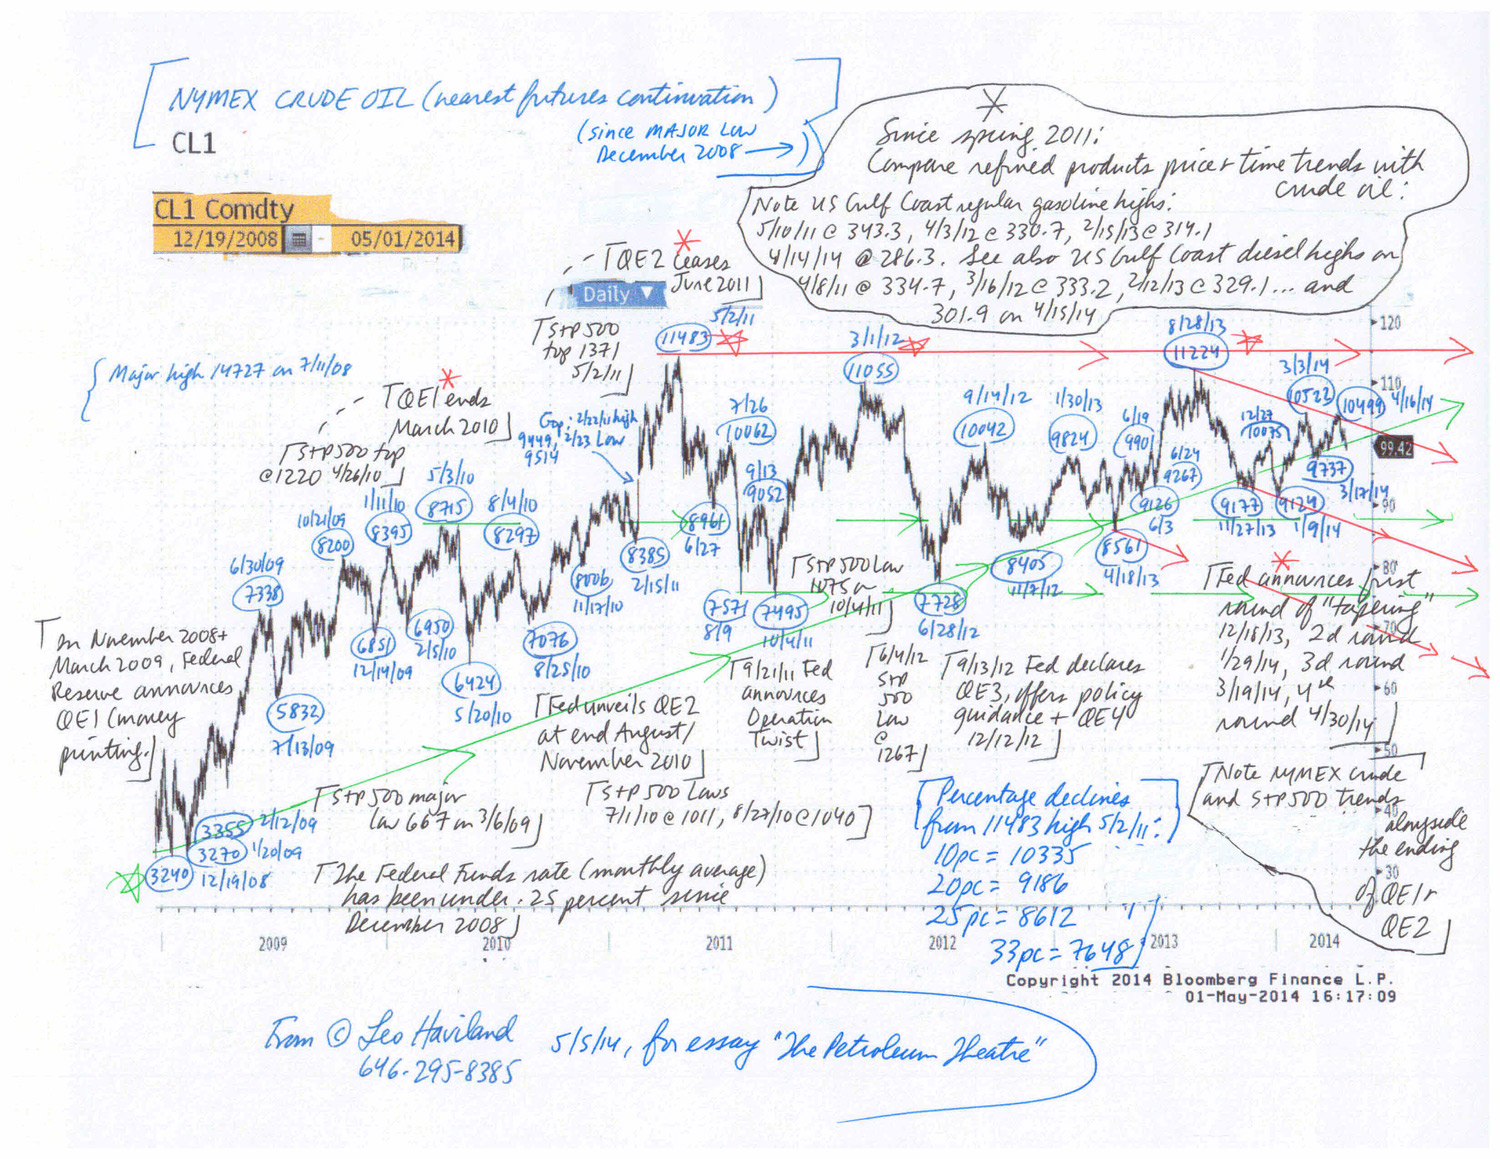
Despite modest global economic growth and forecasts by leaders such as the International Monetary Fund for further expansion, despite sustained highly accommodative monetary policy by the Federal Reserve Board and its allies, look at petroleum price benchmarks such as NYMEX and ICE Brent/Sea crude oil contracts (nearest futures continuation), as well as at US Gulf Coast regular gasoline and diesel. These gradually have retreated from their 2011/2012 peaks.
Note the similar weakness in emerging stock marketplaces “in general”, including China’s. Indeed, Chinese economic growth probably is significantly less than many believe. Given China’s major role in the world commodities arena, that portends further weakness in the overall commodities universe (see the S+P broad GSCI or other indices) and petroleum in particular.
Moreover, the Federal Reserve continues to taper its gargantuan bond buying (money printing) program. Ceasing money printing in 2010 and 2011 encouraged United States equity (use the S+P 500 as a benchmark) and commodity (and emerging stock) marketplace weakness. Though history may not repeat itself, the Fed’s ending of this round of quantitative easing probably will maintain the current sideways to down pattern in the petroleum complex. In recent years, the S+P 500 and commodities “in general” (including the overall petroleum complex) have tended to make noteworthy marketplace turns around the same time. Though the S+P 500 of course continued its bull move since spring 2011 while commodities in general moved in sideways to down fashion, this timing turning point relationship since spring 2011 has tended to persist.
Moreover, overall OECD petroleum industry inventories probably are slightly high, with total US days coverage several days above average. Supply/demand estimates for calendar 2014 indicates that global oil stocks will not decline much if at all this year.
FOLLOW THE LINK BELOW to download this article as a PDF file.
The Petroleum Theatre (5-5-14)
Charts- NYMEX and Brent crude oil
The S+P 500 high on 4/4/14 at 1897 probably is an important top. “US Stocks: Shadows and Signals” (2/3/14) remarked that “during the darkest days of the worldwide economic crisis of late 2008/early 2009 as well as during the subsequent recovery, Federal Reserve Board easy money policies have played key roles in encouraging bull moves in the S+P 500 (and many other equity playgrounds). Likewise, the elimination of some of these schemes, particularly previous rounds of quantitative easing (money printing), has occurred alongside highs in American stock benchmarks. What does tapering foreshadow? The Fed’s recent decision to reduce (taper) and eventually eliminate the current gigantic round of money printing warns that a notable top is or relatively soon will be in place.”
As it has in the past, the Federal Reserve will try to prevent a substantial stock marketplace tumble. But unless the S+P falls around ten percent, they probably will say or do little of note. However, if the S+P dives ten percent or more, the Fed lions probably will roar about their determination to sustain recovery. A slump of about 20 percent from a peak (especially if it occurs quickly) boosts the chances that they will slow their current tapering program.
Within and across fields such as stocks, interest rates, currencies, commodities, and real estate, the ardent hunt for sufficient “yield” by “investors” and others never ceases. Recall the glorious Goldilocks Era which preceded the worldwide economic disaster that emerged in mid-2007 and accelerated in 2008. As the Goldilocks Era neared its end prior to those dreadful days, packs of marketplace players eagerly foraged around in diverse (and sometimes very remote or complex) landscapes for adequate yield (good “investment” opportunities; fine returns). The global economic recovery began around mid 2009, with calendar year real GDP growth resuming in 2010. Over the most recent year or two in financial marketplaces (and especially currently), as during the late stages of the Goldilocks Era, the search for yield increasingly has become widespread and rabid. Such sustained heated quests, when reviewed alongside other indicators, warn of economic dangers.
FOLLOW THE LINK BELOW to download this article as a PDF file.
Money Jungle (4-14-14)
Charts- S+P 500 and others (4-14-14, for essay Money Jungle)


 View Leo Haviland’s profile