

THE PETROLEUM THEATRE © Leo Haviland May 5, 2014
The worldwide petroleum marketplace “in general” will continue its sideways to down trend.
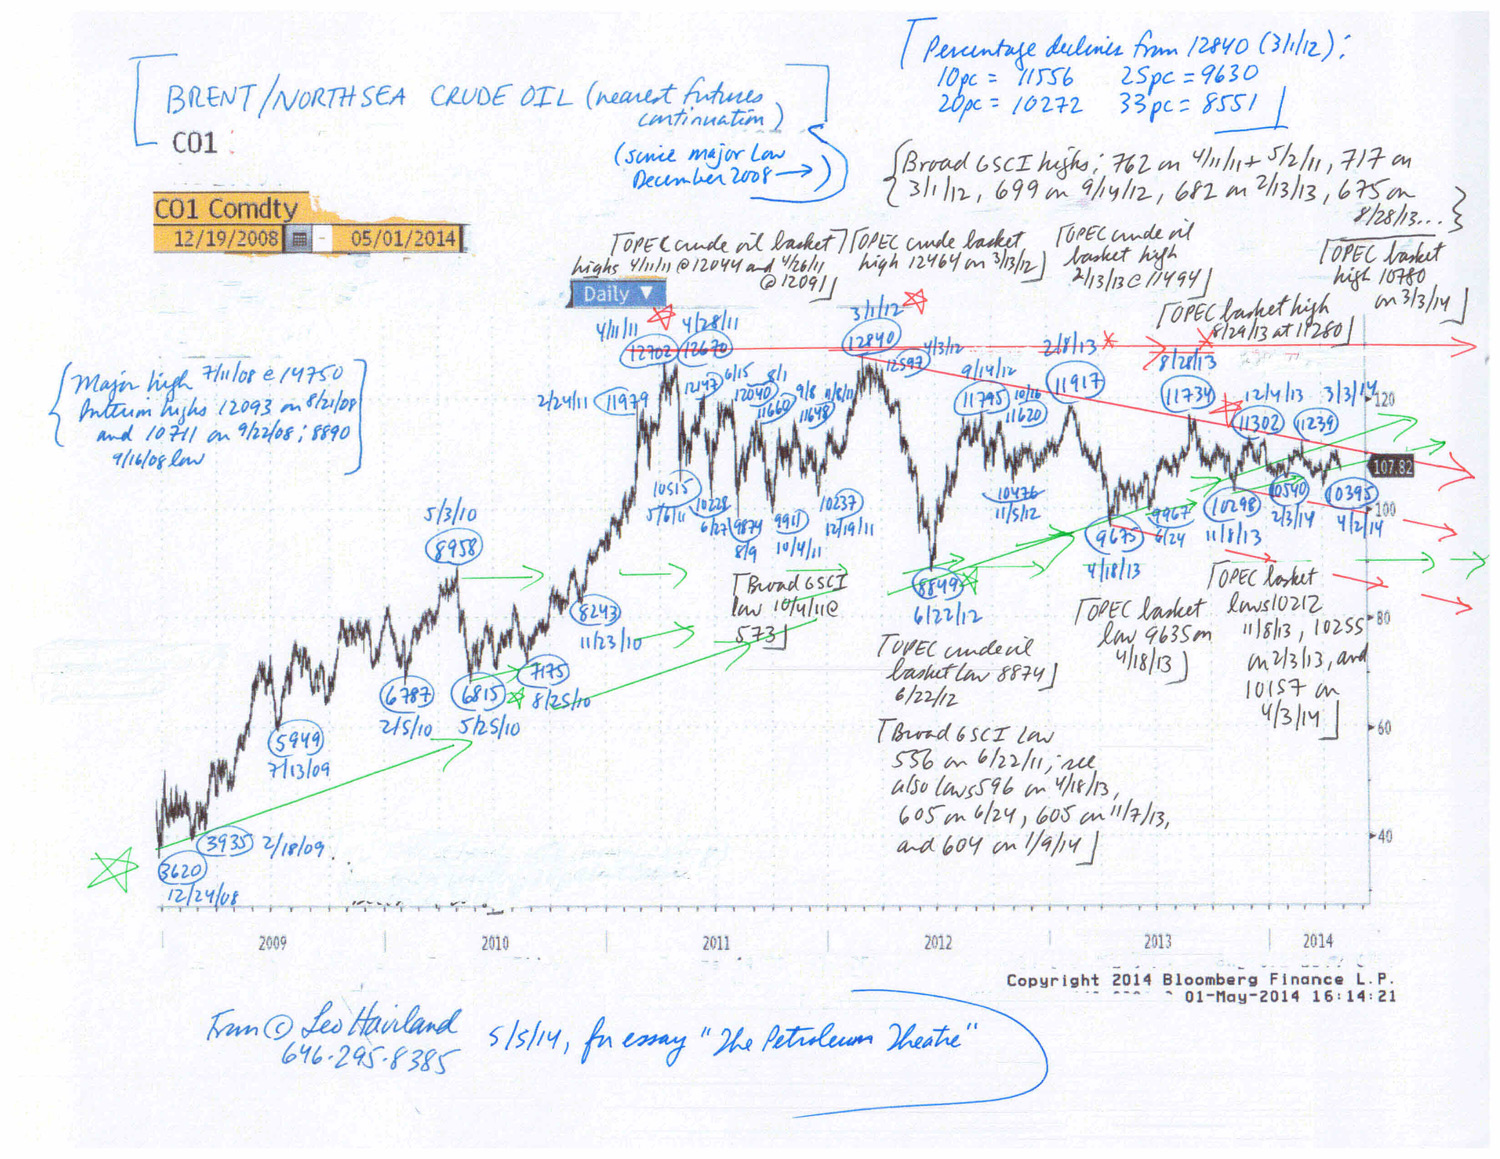
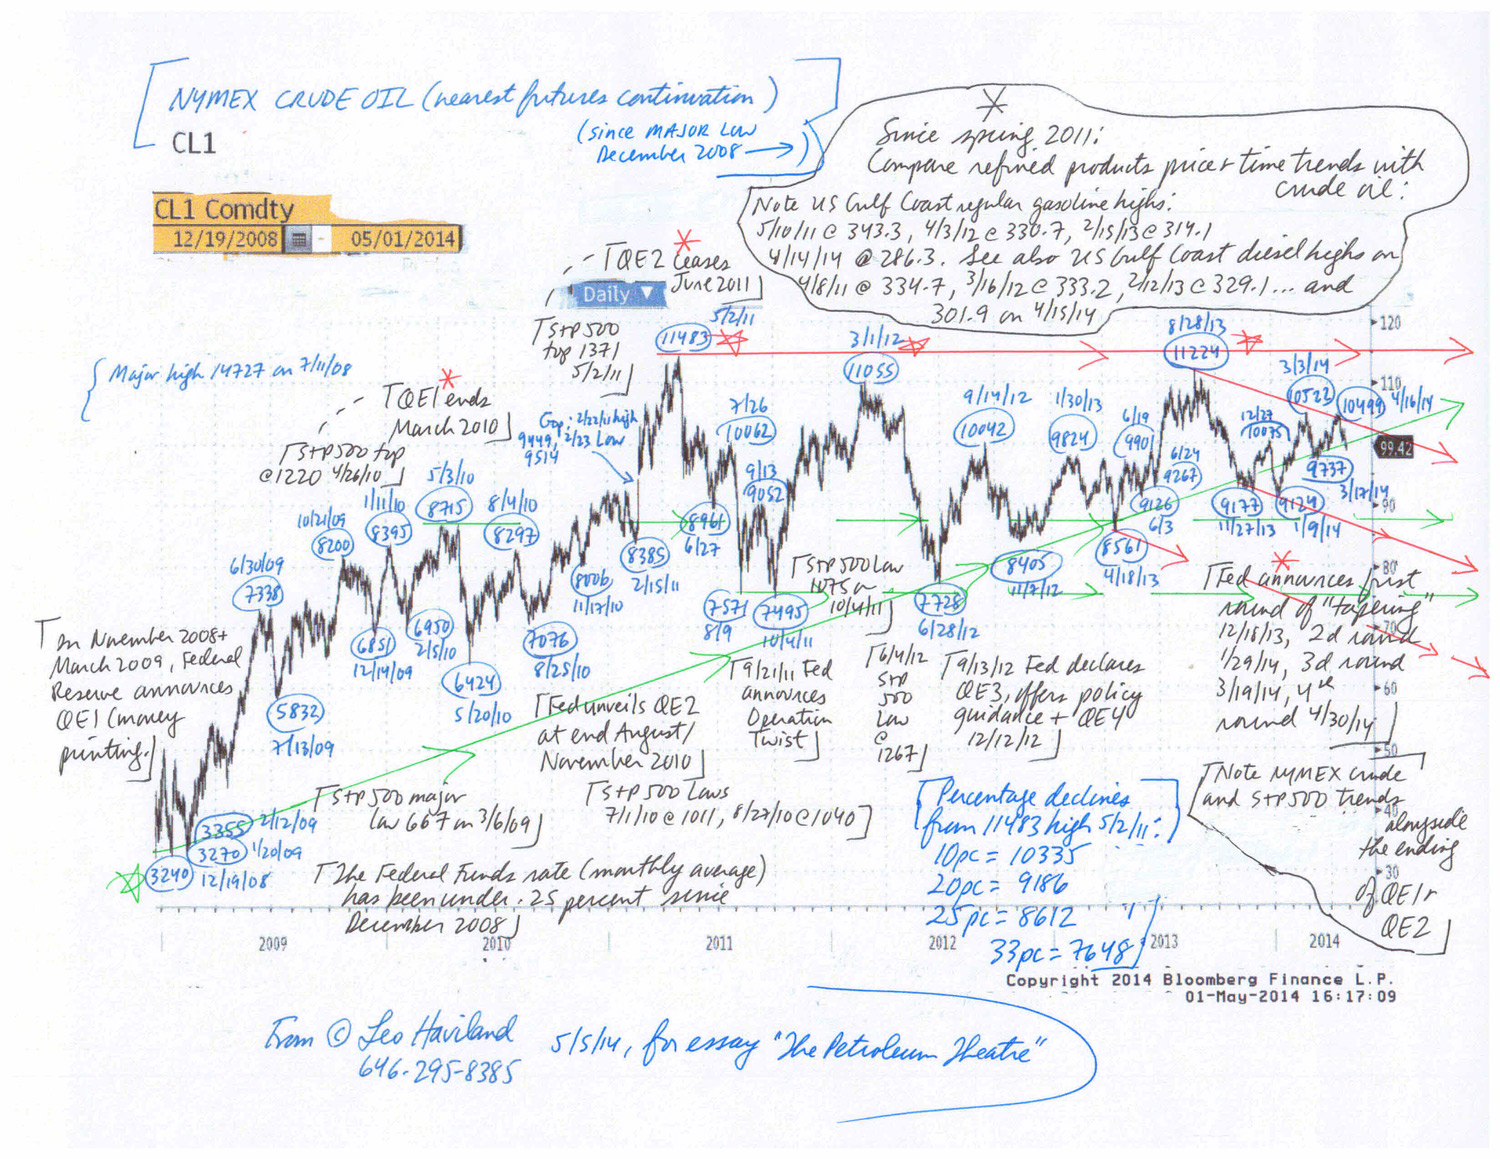
Despite modest global economic growth and forecasts by leaders such as the International Monetary Fund for further expansion, despite sustained highly accommodative monetary policy by the Federal Reserve Board and its allies, look at petroleum price benchmarks such as NYMEX and ICE Brent/Sea crude oil contracts (nearest futures continuation), as well as at US Gulf Coast regular gasoline and diesel. These gradually have retreated from their 2011/2012 peaks.
Note the similar weakness in emerging stock marketplaces “in general”, including China’s. Indeed, Chinese economic growth probably is significantly less than many believe. Given China’s major role in the world commodities arena, that portends further weakness in the overall commodities universe (see the S+P broad GSCI or other indices) and petroleum in particular.
Moreover, the Federal Reserve continues to taper its gargantuan bond buying (money printing) program. Ceasing money printing in 2010 and 2011 encouraged United States equity (use the S+P 500 as a benchmark) and commodity (and emerging stock) marketplace weakness. Though history may not repeat itself, the Fed’s ending of this round of quantitative easing probably will maintain the current sideways to down pattern in the petroleum complex. In recent years, the S+P 500 and commodities “in general” (including the overall petroleum complex) have tended to make noteworthy marketplace turns around the same time. Though the S+P 500 of course continued its bull move since spring 2011 while commodities in general moved in sideways to down fashion, this timing turning point relationship since spring 2011 has tended to persist.
Moreover, overall OECD petroleum industry inventories probably are slightly high, with total US days coverage several days above average. Supply/demand estimates for calendar 2014 indicates that global oil stocks will not decline much if at all this year.
FOLLOW THE LINK BELOW to download this article as a PDF file.
The Petroleum Theatre (5-5-14)
Charts- NYMEX and Brent crude oil