GLOBAL ECONOMICS AND POLITICS
Leo Haviland provides clients with original, provocative, cutting-edge fundamental supply/demand and technical research on major financial marketplaces and trends. He also offers independent consulting and risk management advice.
Haviland’s expertise is macro. He focuses on the intertwining of equity, debt, currency, and commodity arenas, including the political players, regulatory approaches, social factors, and rhetoric that affect them. In a changing and dynamic global economy, Haviland’s mission remains constant – to give timely, value-added marketplace insights and foresights.
Leo Haviland has three decades of experience in the Wall Street trading environment. He has worked for Goldman Sachs, Sempra Energy Trading, and other institutions. In his research and sales career in stock, interest rate, foreign exchange, and commodity battlefields, he has dealt with numerous and diverse financial institutions and individuals. Haviland is a graduate of the University of Chicago (Phi Beta Kappa) and the Cornell Law School.
Subscribe to Leo Haviland’s BLOG to receive updates and new marketplace essays.

Assuming normal weather for spring and summer 2014, the NYMEX natural gas complex in general, including the nearest futures continuation benchmark, probably will trade in a sideways to rising trend.
United States natural gas inventory days coverage at the end of the 2013-14 winter draw season is very low arithmetically (bcf) as well as from the more important days coverage vantage point. However, winter ends every year. As the April/October build season will diminish short term fears of running out of natural gas, bears snarl that it becomes more difficult to sustain prices over 5.00. Yet for prices to remain under 5.00 over the upcoming summer build and winter 2014-15 draw seasons, much depends on whether 2014 gas production climbs by significantly more than two bcf/day year-on-year. The Energy Information Administration predicts a 1.8bcf/day output increase (Short-Term Energy Outlook, “STEO”, Table 5a, 3/11/14; next release 4/8/14). Some assert that fuel switching from natural gas to coal will occur in the key electric power sector in calendar 2014 if natural gas prices remain at current levels, and especially if they trend higher. The EIA believes 2014 electric power demand edges about .3bcf/day lower relative to 2013’s level (though calendar 2015’s ascends a modest .6bcf/day versus 2014). Keep in mind the still substantial net noncommercial long position in natural gas at present. All else equal, liquidation of a substantial part of that net length would weaken prices.
Yet analysis of the days coverage variable constructs a bullish case. Assume normal spring and summer weather. Suppose the EIA’s production estimate does not greatly miss the actual output boost. Then not only in the early months of build season, but also at its close at end October (or early November), days coverage for US natural gas inventories will remain well below average (typical, normal; desired). Admittedly, the United States natural gas inventory situation probably will become less tight over the course of winter 2014-15. If late autumn and winter weather is normal, working gas inventories days coverage probably still will be somewhat below normal during winter 2014-15 since they should commence draw season at very depressed levels.
The list of uncertainties surrounding natural gas supply/demand is long. But given that US gas stocks are very depressed now, a look forward at the probable working gas inventory situation for the next several months suggests the NYMEX nearest futures continuation contract probably will break into the 500/520 range over the next several months, and perhaps by the end of summer.
Read the rest of this entry »
FOLLOW THE LINK BELOW to download this article as a PDF file.
US Natural Gas- Building Up (4-1-14)
In recent weeks, much marketplace and media attention has underlined growing United States household net worth as well as decreasing household indebtedness as a percentage of GDP. Pundits proclaim that federal budget deficits have substantially declined from the towering heights of only a couple of years ago. Hasn’t the American and worldwide economy generally improved since the dreadful times of late 2008/early 2009? Americans point to the stratospheric rise of the S+P 500 since its March 2009 major low around 667. And look at those great US corporate earnings of the past couple of years! All such talk surely encourages optimism regarding the American financial situation, as has the related sustained highly accommodative monetary policy rhetoric and action of the Federal Reserve Board and its central banking comrades around the globe. Yet although Fed policies such as gargantuan money printing, severe interest rate repression, and fancy wordplay regarding forward guidance have boosted morale and purchased time for action on America’s major debt problem, they have not bought a solution to that issue.
To better perceive and assess America’s debt challenge, sentinels should adopt a wider perspective, focusing on the overall United States debt situation over a long historical period. For over five decades, from the early 1950s up through the glorious Goldilocks Era that ended in 2007, and for a couple of years thereafter, total US indebtedness as a percentage of nominal GDP climbed steadily and substantially.
Remarkably little progress has been made in the comprehensive (all-inclusive) US debt situation since 2009’s very lofty percentage. Increasing federal indebtedness has substantially though not entirely outweighed improvements in the consumer and state and local government sectors. Since the national government is a representative (democratic; “We, the People”) one, the general US debt situation has not mended significantly. In addition, although the federal budget deficits will remain relatively small (at least compared to the mammoth gaps of a few years ago), they gradually expand after the next few years. The ongoing substantial US debt mountain consequently remains a long run burden on, and probably also a near term problem for, US and international economic growth.
This review of total American credit marketplace debt portrays the development of a national culture of debt. The long run trend probably indicates a growing bias toward consumption and spending rather than saving. The increasing borrowing and massive debt accumulation arguably in part also probably reflect an increasingly widespread sense of entitlement to American Dream goals of the “good life” and a “better life”.
FOLLOW THE LINK BELOW to download this market essay as a PDF file.
America the Debtor (3-17-14)
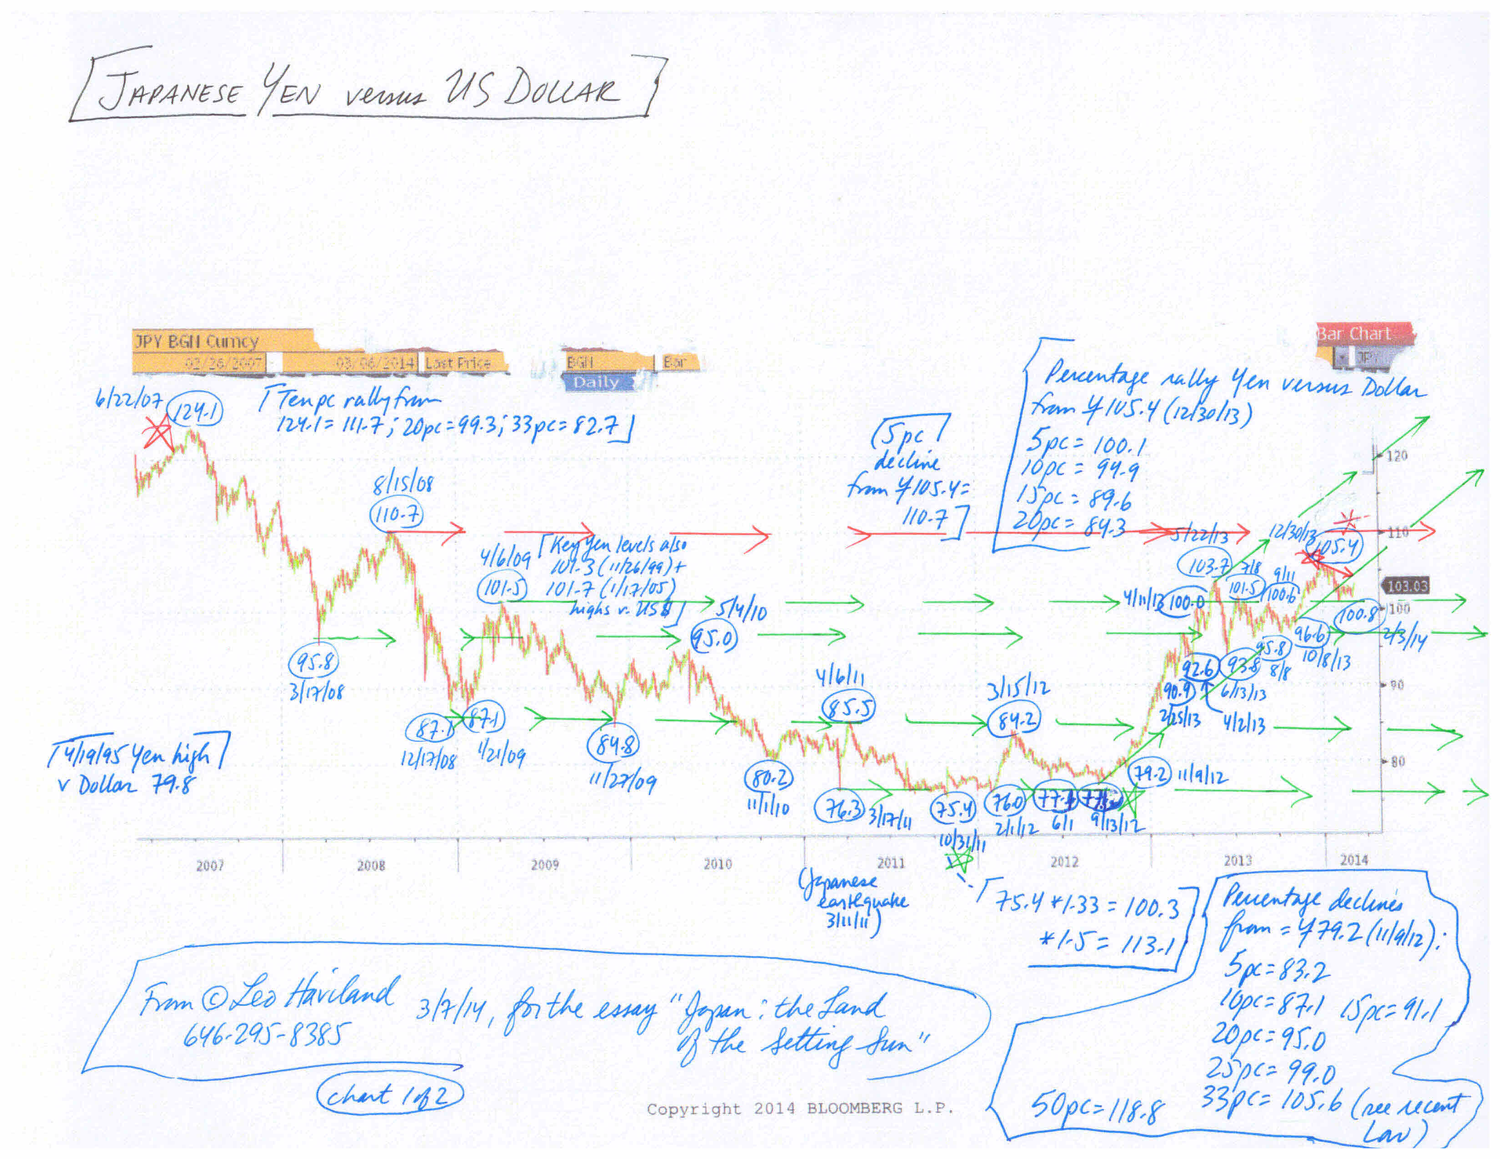
In recent months, economic and political excitement within assorted emerging, developing, and frontier nations have entranced most marketplace observers and captured the attention of numerous politicians in the United States and other so-called advanced nations. In contrast, Japan, having once been in the limelight, nowadays stands in the background of the international financial theater. However, Japan currently deserves more of a starring role.
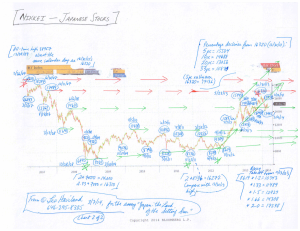
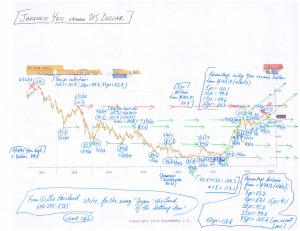
Japan’s changing political leadership in late 2012 and the subsequent major new round of substantial monetary laxness encouraged major- and intertwined- Japanese Yen weakness and Japanese equity (Nikkei) strength. The new Japanese policies, the Nikkei’s stratospheric rally, and the Yen’s rapid bear tumble probably helped to encourage global economic optimism in general as well as rallies in the S+P 500 and many other key world stock marketplaces in particular.
Yet at present, many players nevertheless increasingly take for granted Japan’s extraordinary monetary easing actions of early 2013 (and related other parts of “Abenomics”) and their marketplace consequences. Clairvoyants likewise currently place comparatively little emphasis on Japan’s current sluggish GDP prospects. They also do not underline that both the Japanese Yen and Nikkei apparently entered into a sideways trend beginning around late May 2013.
Of course diverse and entangled variables influence economic levels and trends (and storytelling about them), whether in Japan or elsewhere. But because Japan rather recently ventured on such extraordinary monetary easing, signs of mediocre Japanese economic performance warn that other very lax central bank policies increasingly will have diminished growth benefits as time passes. For example, the International Monetary Fund predicts Japan’s calendar 2015 real GDP will increase merely one percent. Japan also has not escaped its gloomy government spending and debt situation. The sideways trends in the Nikkei and Yen arguably reflect such current (potential) Japanese performance.
The recent high in Japanese stocks and bottom in the Yen probably will not be broken by much if at all any time soon. Also, a notable (even if not major) decline in the Nikkei from its recent peak alongside a rally in the Yen relative to its recent low will be a bearish sign for the world economy as well as for the S+P 500 and many other stock marketplaces.
FOLLOW THE LINK BELOW to download this market essay as a PDF file.
Japan- the Land of the Setting Sun (3-7-14)
Charts- Japanese Yen and Nikkei (3-7-14)
United States natural gas inventory days coverage probably will be quite low at the end of the 2013-14 winter draw season. The NYMEX natural gas complex includes not only the nearest futures continuation benchmark, but also actual calendar months and actual seasonal (summer; winter) and calendar year strips. These various marketplaces do not necessarily all travel in the same fashion. Yet assuming normal weather for the balance of this winter, the NYMEX natural gas complex “in general” probably will continue its major bull move.
Given the expected low days coverage in US natural gas inventories by end March 2014, it would be unsurprising if the NYMEX nearest futures continuation contract significantly challenged major resistance around 6.10 (recall the January 2010 pinnacle). However, as winter ends and the nearest futures natural gas contract becomes a springtime one (such as April 2014 or May 2014), sustained moves in the front month contract over 6.10 will be difficult (at least in the near term). The supply/demand situation for the actual March 2014 gas contract (the current nearest futures) is not quite the same as that for the May 2014 one (when inventories are building). If colder than normal weather occurs during the balance of this February and March, a spike above the 610 summit (even if it does not last very long) is probable.
Admittedly, the NYMEX natural gas complex is vulnerable to a rather significant price decline from recent tops. Suppose weather for the balance of this winter season is warmer than normal; that may help to inspire a price drop.
However, even with normal weather, interim price declines may occur. Although the current inventory situation in US natural gas displays rather low days coverage relative to consumption, the shortage will become less severe during calendar 2014 as a whole due to a year-on-year rise in production and fall in demand.
Though the April through October 2014 build season probably will reduce the existing significant days coverage shortfall, it will not eliminate it. Since days coverage for the next several months (through the 2014 build season at least) probably will remain somewhat below normal, this will tend to support prices in the NYMEX natural gas complex in general.
FOLLOW THE LINK BELOW to download this market essay as a PDF file.
US Natural Gas- Drawing Conclusions (2-17-14)
Charts- NYMEX natural gas (3 charts, for essay US Natural Gas- Drawing Conclusions) (Feb 17, 2014)


 View Leo Haviland’s profile