GLOBAL ECONOMICS AND POLITICS

Leo Haviland provides clients with original, provocative, cutting-edge fundamental supply/demand and technical research on major financial marketplaces and trends. He also offers independent consulting and risk management advice.

Haviland’s expertise is macro. He focuses on the intertwining of equity, debt, currency, and commodity arenas, including the political players, regulatory approaches, social factors, and rhetoric that affect them. In a changing and dynamic global economy, Haviland’s mission remains constant – to give timely, value-added marketplace insights and foresights.

Leo Haviland has three decades of experience in the Wall Street trading environment. He has worked for Goldman Sachs, Sempra Energy Trading, and other institutions. In his research and sales career in stock, interest rate, foreign exchange, and commodity battlefields, he has dealt with numerous and diverse financial institutions and individuals. Haviland is a graduate of the University of Chicago (Phi Beta Kappa) and the Cornell Law School.


Subscribe to Leo Haviland’s BLOG to receive updates and new marketplace essays.

RSS View Leo Haviland's LinkedIn profile View Leo Haviland’s profile



US INFLATION SIGNALS © Leo Haviland June 7, 2015

In their noble war to generate sufficient inflation, insure economic recovery, and slash unemployment, central bankers in America, Europe, and Japan have fought with extraordinary weapons such as monumental money printing and longstanding interest rate yield repression. On the inflation front, they battle furiously to achieve and sustain an inflation target of about two percent. This allegedly good (desirable, reasonable, prudent) goal contrasts not only with bad “excessive” inflation, but also with bad “too low” inflation and evil (or at least really bad) of deflation.

For several months, widely-watched inflationary yardsticks such as the consumer price index indicated too low inflation or inflamed worries regarding deflation. The consequences of the 2007-2009 international economic disaster probably have not disappeared, and the dramatic slump in petroleum prices after mid-2014 has troubled many inflation seekers. In any event, most economic forecasters, including central banking captains, have postponed the achievement of sufficient inflation as measured by such signposts rather far out into the future. Consequently, marketplace warriors, political leaders, and the financial media have focused relatively little on other gauges warning of notable potential for increased inflation in benchmarks such as the consumer price index.
****

The worldwide global economy of course is interconnected and complex. Numerous variables intertwine to produce any given inflation level and trend. Inflation acceleration need not appear first or strongest in beloved indicators such as consumer prices or personal consumption expenditures. Although the United States is not a financial island, focus on the American landscape.

“Inflation” is not confined to measures such as the CPI or personal consumption expenditures; “the economy” includes other inflation benchmarks. Various indicators signal there is more inflation “around” in the US than most believe. Underline American wage increases. Note central bank and marketplace murmurings regarding high valuations or so-called asset bubbles; keep in mind the climbs in US equities and home prices from their financial crisis depths. Money supply growth remains robust. The steely determination of the Fed and its central banking allies to achieve their inflation objectives heralds that monetary policy probably will remain quite lax for some time even if the US eventually raises rates. These factors collectively warn that at least in America, deflationary forces “in general” have found strong adversaries. The recent spike in key interest rates such as the 10 year US government note (and the German Bund) in part reflects this inflation.

Despite the recent rate of change in US consumer prices and personal consumption expenditures, probably neither deflation nor dangerously low inflation are on the American horizon. In addition, sustained “too low” inflation in America probably should not be a worry for the near term. Nevertheless, although a sustained jump in PCE and CPI inflation rates much beyond the Fed’s desired two percent target currently appears unlikely, “sufficient” inflation in America may be achieved faster than many predict.
****

“Flights to quality”, hunts for suitable yield (return), and other supply/demand considerations, not just low inflation statistics, can rally prices of debt securities. Yet did sustained central bank yield repression create or at least encourage “too low” yields for (a price “bubble” in) key government debt securities such as those of the United States and Germany? In the Eurozone, the terrifying enemy called deflation neared. The European Central Bank fired back with a huge quantitative easing (money printing) plan involving government debt securities. Some European government security interest rate yields went negative.

However, was a US (and German) debt security price bubble recently popped?

The 10 year US government note established an important yield low at 1.64 percent on 1/30/15, above 7/25/12’s major bottom at 1.38pc. Since January 2015’s valley, the US 10 year rate shot up about 50 percent to 6/5/15’s 2.44pc. The 1/2/14 summit at 3.05pc represents important resistance. In any case, what should the yield on US 10 year government notes be if inflation (such as in the PCE) is 1.5 percent or higher?

The 10 year German government note made a key bottom on 4/17/15 close to zero, at .05 percent (not long after the UST 10 year note made a minor low at 1.80pc on 4/3/15). Bund yields thereafter blasted higher, reaching almost one percent on 6/4/15. The Japanese 10 year JGB made a significant trough in 2015 shortly before the UST’s, on 1/20/15 at .20 percent.

US stocks advanced victoriously from their March 2009 major low for many reasons, including strong corporate earnings and share buybacks. Yet money printing and yield repression also assisted the S+P 500’s mighty ascent. So if US stocks recently reached “too high” levels, perhaps rising interest rates (or growing fears of them) will inspire those equities to retreat (burst their bubble).

Regardless of whether or not American government note yields recently were (or are still) “too low”, the recent sharp increase in UST 10 year note rates may reflect not just a “technical correction” or a growing belief that the Federal Funds rate (and thus yields in US government securities) will rise in the relatively near future. That noteworthy UST yield leap probably also warns that US inflation “in general” has grown or will do so soon.

FOLLOW THE LINK BELOW to download this article as a PDF file.
US Inflation Signals (6-7-15)
OIL’S TROUBLED WATERS © Leo Haviland May 18, 2015

Where will petroleum prices voyage over the next several months? Although it is a difficult call benchmark NYMEX and Brent/North Sea crude oil prices probably are establishing a broad range. For NYMEX crude oil (nearest futures continuation), the range is roughly between $40-$45 and $65-$75 per barrel. On balance, crude oil prices probably will venture more to the middle to lower section of that range.

****

Petroleum’s supply/demand scene appears especially unsettled and uncertain. Navigating through that territory is challenging. However, “by itself (all else equal)”, the oil picture nowadays and for the near term looks bearish. Is OPEC’s new policy of reducing high-cost (non-OPEC) production succeeding? Not much so far. Despite the dive in drilling rig counts, OECD days coverage levels and the worldwide supply/demand balance for 2015 reveal plentiful petroleum.

Worldwide petroleum inventories generally are lofty and likely to remain so for the next several months. Though global oil consumption will edge up alongside rather modest economic growth, supply probably will exceed demand. Suppose benchmark Brent/North Sea prices (spot; or nearest futures continuation) sustain levels over $50 (and perhaps even $45) per barrel. Suppose non-OPEC production remains relatively high. Then OPEC, led by Saudi Arabia, probably will not alter its current output policy aimed at capturing market share and reducing actual and planned high-cost production in the United States and elsewhere.

Within OPEC, and apart from the policies of Saudi Arabia and its Gulf States allies, production developments from several important nations remain conjectural. Consider Iran, Iraq, and Libya. For example, predicting the outcome of the Iranian nuclear negotiations is hazardous. But even if the talks drag out beyond the end of June 2015, they probably will have a relatively successful conclusion resulting in increased Iranian crude oil production. Iraqi output, despite its civil strife, probably will keep rising. Due to the Libyan civil war, production there currently has little room to fall further. Might it spout higher if a peace agreement is reached? Will Nigeria and Venezuela maintain their current production levels?

Noncommercial participants in petroleum playgrounds also influence oil price trends. Over the past several months, a substantial increase in the net noncommercial long position has helped to propel petroleum prices upward. However, given the oversupply situation in the petroleum battlefield, the net noncommercial length arguably is vulnerable. Its liquidation consequently will pressure oil prices lower.

Uncertainties for marketplace variables “outside” the oil patch of course intertwine with those inside it. These factors appear particularly tumultuous and complicated nowadays, making it especially difficult to forecast petroleum price trends and levels. Petroleum supply/demand and prices are hostage not only to economic growth trends, but also to movements in interest rates, stocks, and foreign exchange. Policies of the Federal Reserve, European Central Bank (currently engaged in massive money printing) and other major central banks matter. Will the Fed ever raise interest rates? What if American stocks ever slump more than ten percent? US dollar weakness in the past few weeks probably has supported oil prices. What if the broad real trade-weighted dollar renews its bull move?

FOLLOW THE LINK BELOW to download this article as a PDF file.
Oil's Troubled Waters (5-18-15)

CHINA: ITS GREAT GROWTH STORY GROWS OLD © Leo Haviland June 23, 2014

Much of the world currently displays nearly unblinking faith in the expertise of key central bank guardians such as the Federal Reserve Board, European Central Bank, Bank of Japan, and Bank of England. These illuminated central bankers supposedly will continue to play substantial and successful roles in engineering further economic growth via easy money schemes such as interest rate yield repression, quantitative easing (even if money printing ends in America or elsewhere, the securities buying operation may not be unwound quickly, if at all), and forward guidance wordplay. The Fed wizard in particular also surely has an almost pain-free and coherent exit strategy from its longstanding highly accommodative programs, right?

Ongoing trust in such marvelous central bank talent finds a counterpart in widespread belief that the Chinese economic growth miracle will continue for the long run, or at least the foreseeable future. Significant government deficit spending and relaxed credit policies indeed sparked much Chinese growth in recent years. However, Chinese real GDP growth probably has slowed more than many believe. Assorted intertwined variables hint at this reduced expansion and suggest that the slowdown in its growth rate probably will continue over the medium term. Given China’s crucial role in the interdependent global economy, this relative weakness in its GDP growth should have ominous implications for growth elsewhere.

Admittedly, China’s official and private sector debt scene is murky. Yet the edging down of its real GDP growth is occurring in an environment of its increasingly troubling debt and credit situation. All else equal, efforts to solve or at least mitigate debt and credit problems probably will result in greater than expected (desired) cuts in the country’s economic growth rate.

FOLLOW THE LINK BELOW to download this article as a PDF file.
China- Its Great Growth Story Grows Old (6-23-14)
Charts- China (6-23-14, for essay China- Its Great Growth Story Grows Old)

THE PETROLEUM THEATRE © Leo Haviland May 5, 2014

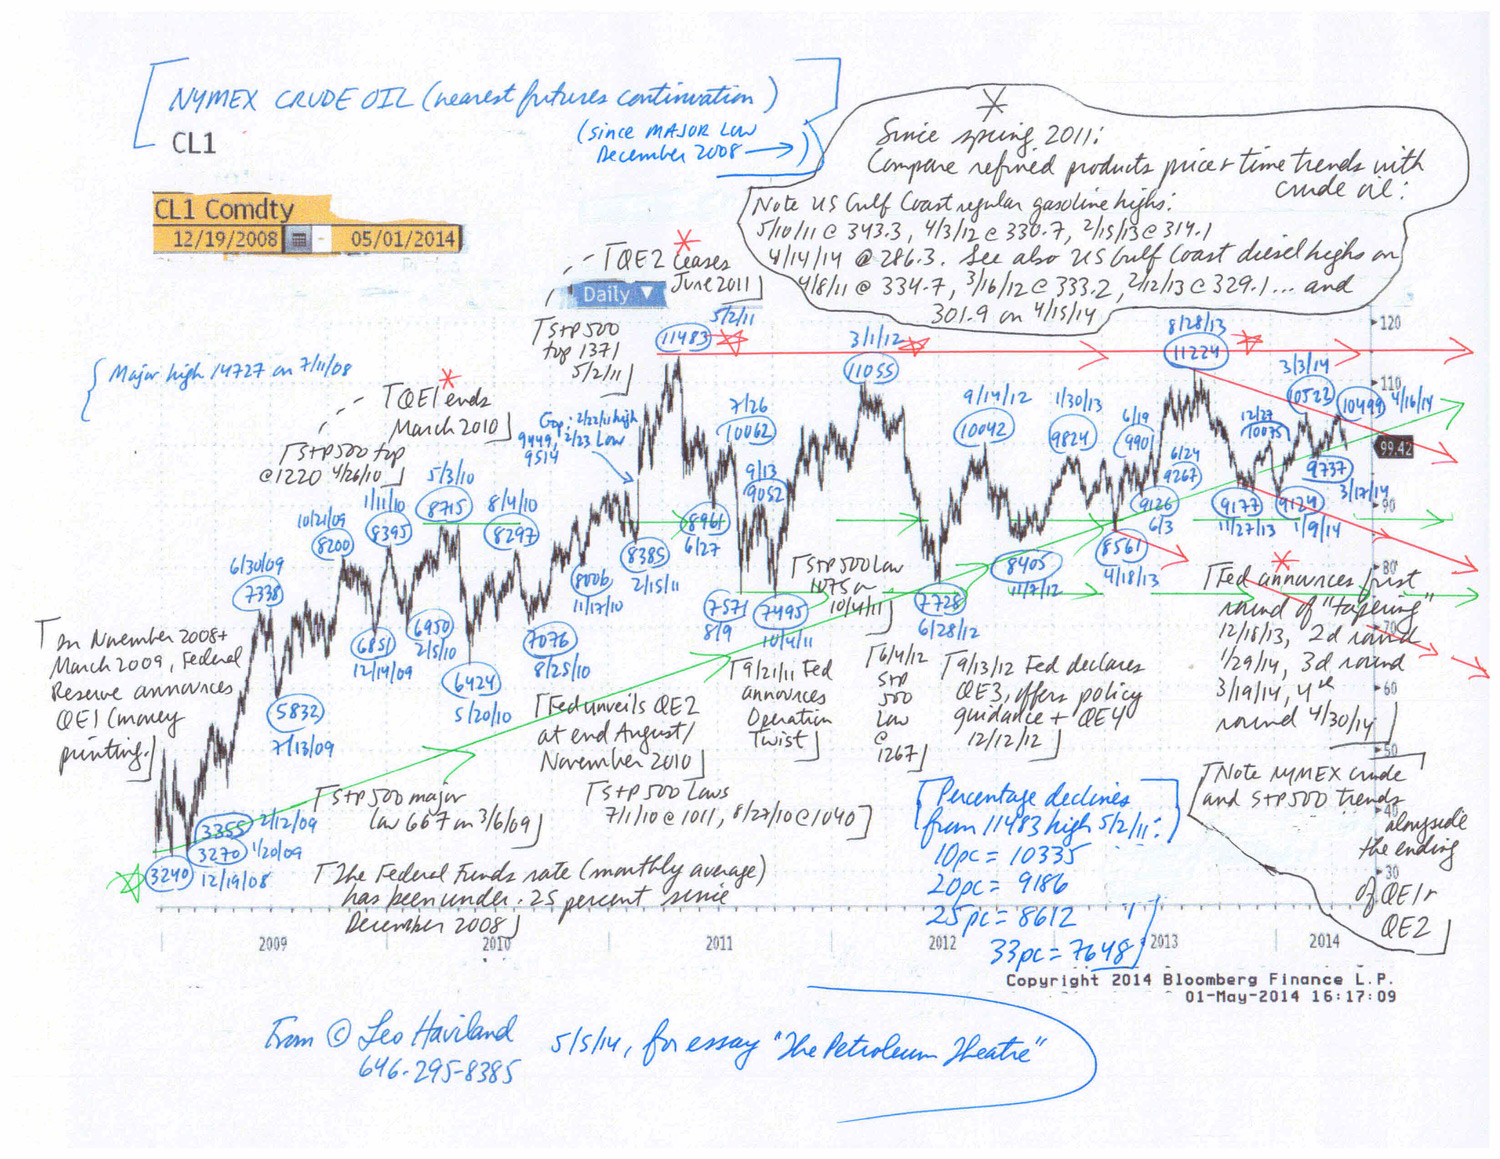
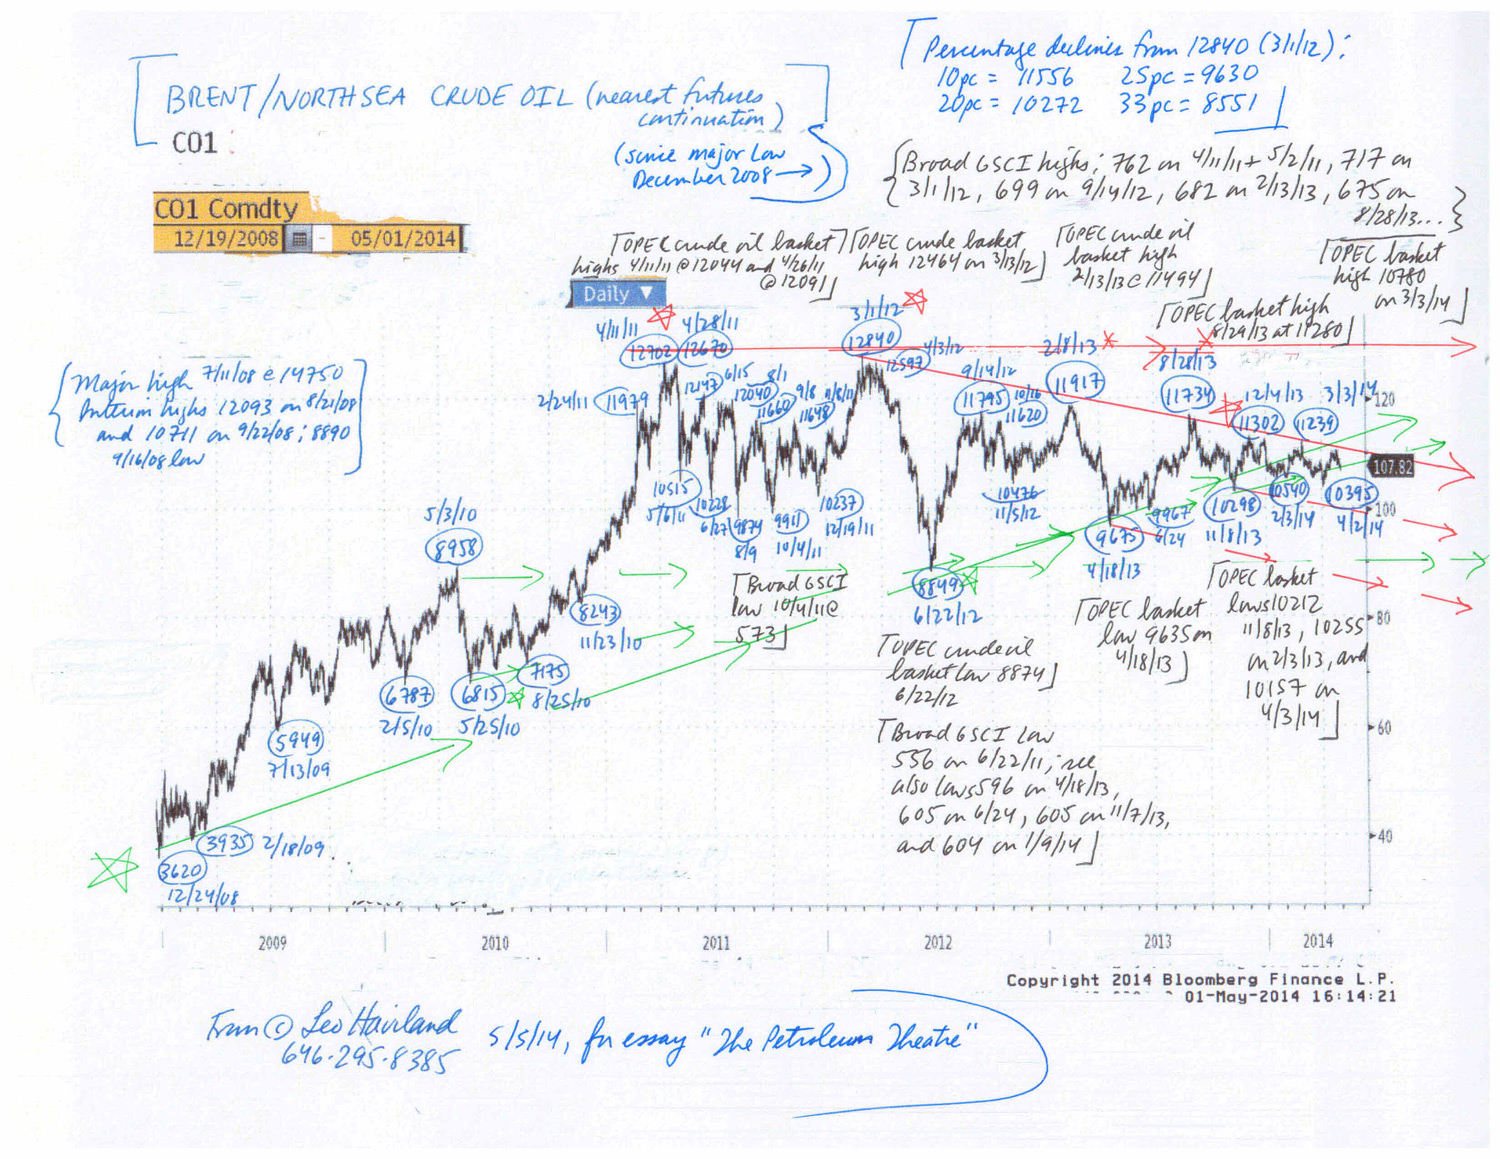
The worldwide petroleum marketplace “in general” will continue its sideways to down trend.

Despite modest global economic growth and forecasts by leaders such as the International Monetary Fund for further expansion, despite sustained highly accommodative monetary policy by the Federal Reserve Board and its allies, look at petroleum price benchmarks such as NYMEX and ICE Brent/Sea crude oil contracts (nearest futures continuation), as well as at US Gulf Coast regular gasoline and diesel. These gradually have retreated from their 2011/2012 peaks.

Note the similar weakness in emerging stock marketplaces “in general”, including China’s. Indeed, Chinese economic growth probably is significantly less than many believe. Given China’s major role in the world commodities arena, that portends further weakness in the overall commodities universe (see the S+P broad GSCI or other indices) and petroleum in particular.

Moreover, the Federal Reserve continues to taper its gargantuan bond buying (money printing) program. Ceasing money printing in 2010 and 2011 encouraged United States equity (use the S+P 500 as a benchmark) and commodity (and emerging stock) marketplace weakness. Though history may not repeat itself, the Fed’s ending of this round of quantitative easing probably will maintain the current sideways to down pattern in the petroleum complex. In recent years, the S+P 500 and commodities “in general” (including the overall petroleum complex) have tended to make noteworthy marketplace turns around the same time. Though the S+P 500 of course continued its bull move since spring 2011 while commodities in general moved in sideways to down fashion, this timing turning point relationship since spring 2011 has tended to persist.

Moreover, overall OECD petroleum industry inventories probably are slightly high, with total US days coverage several days above average. Supply/demand estimates for calendar 2014 indicates that global oil stocks will not decline much if at all this year.

1

2

FOLLOW THE LINK BELOW to download this article as a PDF file.
The Petroleum Theatre (5-5-14)
Charts- NYMEX and Brent crude oil