GLOBAL ECONOMICS AND POLITICS
Leo Haviland provides clients with original, provocative, cutting-edge fundamental supply/demand and technical research on major financial marketplaces and trends. He also offers independent consulting and risk management advice.
Haviland’s expertise is macro. He focuses on the intertwining of equity, debt, currency, and commodity arenas, including the political players, regulatory approaches, social factors, and rhetoric that affect them. In a changing and dynamic global economy, Haviland’s mission remains constant – to give timely, value-added marketplace insights and foresights.
Leo Haviland has three decades of experience in the Wall Street trading environment. He has worked for Goldman Sachs, Sempra Energy Trading, and other institutions. In his research and sales career in stock, interest rate, foreign exchange, and commodity battlefields, he has dealt with numerous and diverse financial institutions and individuals. Haviland is a graduate of the University of Chicago (Phi Beta Kappa) and the Cornell Law School.
Subscribe to Leo Haviland’s BLOG to receive updates and new marketplace essays.

Although China’s economy of course differs from those of other major nations around the globe, it intertwines with them. However, China’s huge debt securities marketplace receives relatively little attention from traders, analysts, and the media in comparison to those of the United States, the Euro Area, and Japan.
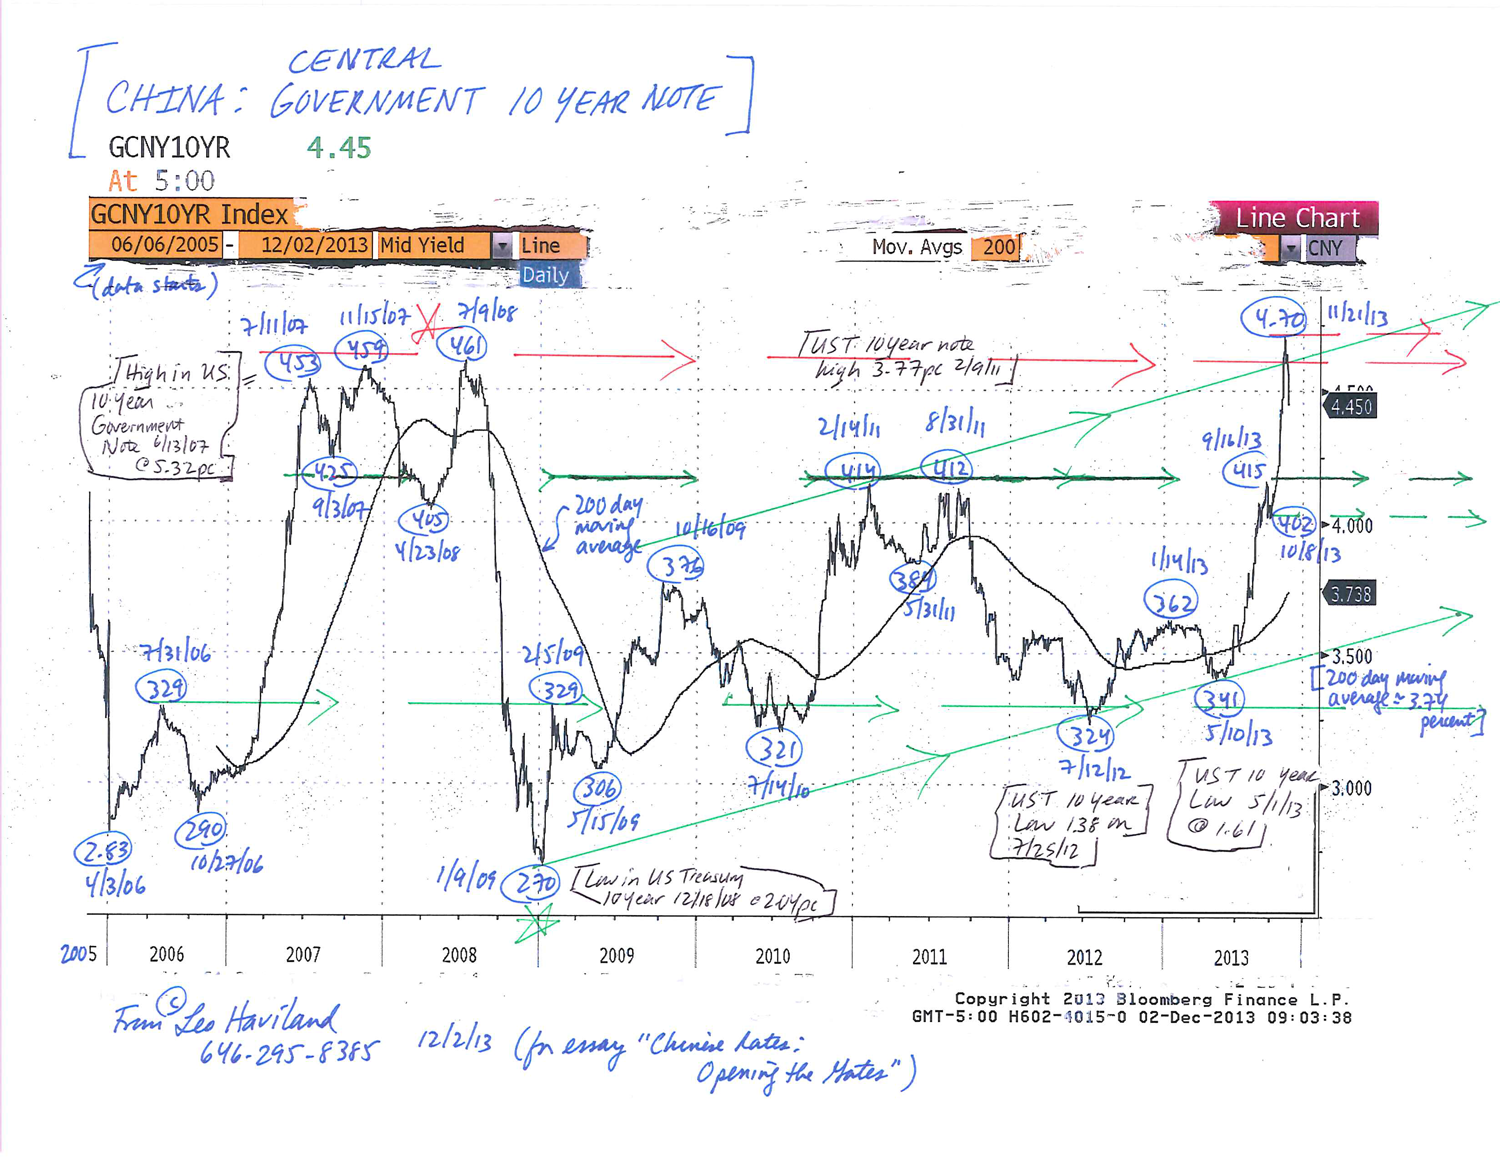
Debt, stock, currency, and commodity marketplace observers concentrating on matters such as Federal Reserve Board policy and the S+P 500’s level and trend should extend their vision to include Chinese interest rates. China’s 10 year government note, after establishing bottoms at 3.24 percent on 7/12/12 and 3.41pc on 5/10/13, has raced higher. After a brief stop at 4.02pc on 10/8/13, the note decisively crashed through 2011’s 4.10pc barrier, recently breaking through 2007-08’s wall around 4.60pc to reach its recent high of 4.70pc on 11/21/13. The one year government note yield likewise has ascended significantly. Chinese government interest rates probably will continue to climb higher.
Near-universal optimism reigns regarding China’s economic situation and prospects. Even if the national economy is relatively robust, it may be less so than many believe.
Given China’s obvious importance to the world economy, a greater than expected slowdown in the marvelous Chinese growth rate, in part due to sustained higher yields, probably would entangle with and undermine recovery prospects in other territories. Moreover, since the end of the joyous Goldilocks Era and during the dreadful international economic crisis and the subsequent recovery, many turning points in the 10 year Chinese government note have occurred around the same time as those in benchmark 10 year US Treasury and German government notes. Thus despite the yield repression policy tightly embraced by the Federal Reserve and its central banking allies, the notable ascent in Chinese government interest rate yields underlines that the overall long run trend for yields in most key nations is probably higher.
FOLLOW THE LINK BELOW to download this market essay as a PDF file.
Chinese Rates- Opening the Gates (12-2-13)
Chart- Chinese Government 10 Year Note (for essay, Chinese Rates- Opening the Gates) (12-2-13)
Industrial metals such as copper and aluminum of course have different supply/demand fundamentals. They intertwine in diverse ways with significant movements in interest rate and currencies, especially the United States dollar. The overall base metals complex often travels in the same fashion (direction) as precious metals. Yet focus on global stock marketplaces in relation to base metals “in general”. Significantly, from the later stages of the glorious Goldilocks Era to its dreadful decline, from the ensuing worldwide recovery up to the present, trends in base metals “in general” very often show the way or confirm trends in key global stock marketplaces.
Price trends in base metals indeed have been closely tied to the China growth story. Yet significant marketplace trend changes in base metals also fit those in emerging stock marketplaces as a whole. The voyage of the base metals complex since roughly mid to late 2007 closely resembles that of emerging marketplaces “in general”. What about in relation to America’s S+P 500? Since its high on 2/14/11 at 4478, the London Metal Exchange base metal index (“LMEX”) has been in a massive bear trend, falling about 35.0 percent to its 6./24/13 low. In contrast, the S+P 500’s glittering advance has continued up to a 1730 high on 9/19/13. But as before 2011, the timing of the S+P 500’s turning points from 2011 to the present in its overall upward climb generally fit rather closely to those in the LMEX index.
The sustained decline in the base metals battleground “in general” since first quarter 2011 continues to signal slower growth in emerging marketplaces in general and in China in particular. Note the continued lowering of growth estimates for China in recent months. In addition, despite the overall directional price trend divergence between the LMEX and the S+P 500, the sustained base metal weakness warns that growth probably will be weak in advanced nations, and that the glowing strength in the S+P 500 will not be eternal.
Read the rest of this entry »
The China economic miracle of recent years has astounded global gurus. Economic policy makers and watchers inside and outside of China forecast its likely continuation. In the intertwined global economy, such sunny predictions about China also aim at boosting confidence regarding international economic growth prospects. Admittedly some Chinese indicators show display reasons for such optimism. And the Financial Times recently remarked “almost everyone agrees that there is little sign that the global economic crisis is about to have a Chinese third act to follow the US and eurozone, which starred in Acts One and Two.” (7/24/13, p6).
Unfortunately, the so-called “real”, “underlying”, and “overall” China economic scene nevertheless is relatively opaque and challenging to understand. Telling any story about the nation’s economy, whether bullish or bearish, requires caution, and audiences should listen to these viewpoints with some skepticism. Many Chinese statistical indicators arguably are difficult to assemble comprehensively as well as to interpret (whether by the Chinese government or outside experts). How accurate is official Chinese economic information? Political considerations perhaps influence the substance of some Chinese data reports.
Moreover, several other signs from or related to China suggest that China’s real GDP growth has tapered faster than many believe. Besides, it may taper a fair amount beneath generally predicted levels of over 7.5 percent. Like the United States and many other nations since the emergence of the worldwide economic disaster, China embarked upon and sustained highly accommodative monetary campaigns and huge deficit spending adventures. Might GDP expansion diminish if these policies (and related credit creation and leverage) are slowed or reversed? Even though China’s overall government debt as a percentage of GDP is less than that of the United States, much of Europe, and Japan, why should China entirely escape the debt challenges and related unpleasant consequences endured by these nations? In contrast to most conventional wisdom, China nowadays probably faces some significant systemic financial (economic) problems.
China’s embrace of debt and credit in recent years is a widespread cultural phenomenon.
If things were going wonderfully within the Chinese economic (and political) system, why would the nation’s leaders underscore territorial quarrels with other nations? Recall the recent squabbles with Japan over tiny islands (Daioyu) controlled by Japan.
What’s the bottom line? China apparently has generated a fair amount of its economic growth from easy money and massive deficit spending (credit, debt, and leverage). It consequently faces a significant challenge of maintaining its high GDP growth rates while tapering accommodative monetary and fiscal deficit policies. In addition, China confronts a modest yet apparently growing systemic problem (risk) tied into these accommodative monetary and fiscal programs and the related lending, leverage, and bad debt issues. Perhaps Chinese control over its economy (especially given that economy’s close connection with the global one) is much less than many claim. Looking forward, Chinese growth probably will taper more than most believe. In any event, one should not have blind faith in the continuation (repetition) of the recent extraordinary Chinese growth story.
FOLLOW THE LINK BELOW to download this market essay as a PDF file.
Another Marketplace Tapering Tale- the China Story (9-9-13)
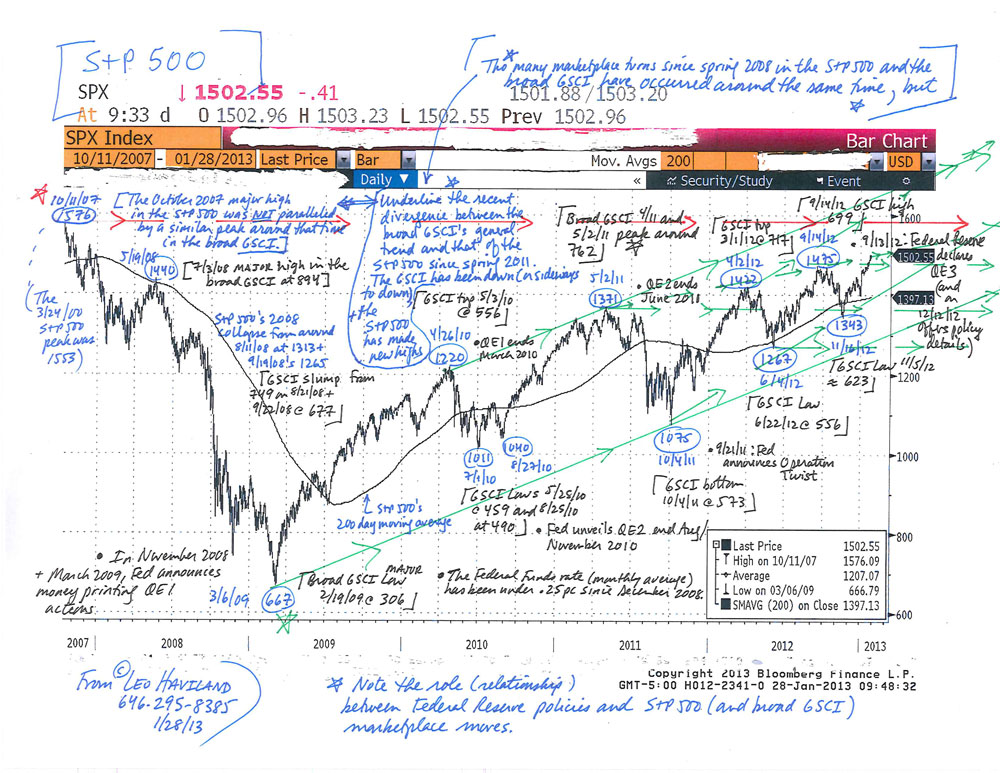
Since mid-2008, commodities “in general” and United States stocks “as a whole” have moved roughly in the same direction at around the same time. In this convergence process (relationship), noteworthy bull (bear) moves in US equities find parallels in those in the commodity arena. Thus significant marketplace rallies (declines) have tended to occur around the same time.
However, this perspective is not the only vantage point by which to assess the often close relationship between US equities and the commodities complex. There also is another, longer run view by which one can examine the relationship between them. Since spring 2011, commodities have ventured down (or sideways to down). However, key American stock benchmarks such as the S+P 500 have attained new highs, first in April 2012, then September 2012, and again in January 2013. Thus despite the convergence at assorted timely turning points since spring/ summer 2008, and even though the two territories continue to trade together to some extent, arguably there has been noteworthy divergence in their overall relationships (their trends) since May 2011.
Now recall several of 2007-08’s details. US equities peaked in October 2007, almost nine months before the commodity one in early summer 2008. Only after the final stock marketplace
summit in May 2008 did equities and commodities trade in close tandem. The current longer run relationship thus perhaps likewise reveals divergence, but with the commodity peak to date appearing well before any major S+P 500 one.
In contrast to 2007-08, what if the major peak in commodities is well before that in stocks (and the lag is likewise so great as to suggest divergence)? Suppose- and this admittedly is a key suppose- eventually commodities and US stocks will trade together over the long run. After all, so-called marketplace relationships can change dramatically, whether from the convergence/ divergence (lead/lag) perspective or otherwise. What does continued divergence, the failure of commodities to near or exceed its spring 2011 heights, suggest?
The 2007-08 relationship warns that the current continued failure of commodities to confirm the equity rally eventually will reveal a notable decline in stocks. Since the duration between the spring 2011 commodities top and today’s new highs in the S+P 500 is almost 20 months, whereas that between October 2007’s stock pinnacle and the broad GSCI’s summit in July 2008 was about nine months, the failure of the broad GSCI to achieve new heights should warn equity bulls that a decline may be fairly near in time.
FOLLOW THE LINK BELOW to download this market essay as a PDF file.
Commodities and US Stocks- Convergence and Divergence (1-28-13)
S+P 500 Chart (1-28-13, for essay on Commodities and US Stocks)


 View Leo Haviland’s profile