GLOBAL ECONOMICS AND POLITICS
Leo Haviland provides clients with original, provocative, cutting-edge fundamental supply/demand and technical research on major financial marketplaces and trends. He also offers independent consulting and risk management advice.
Haviland’s expertise is macro. He focuses on the intertwining of equity, debt, currency, and commodity arenas, including the political players, regulatory approaches, social factors, and rhetoric that affect them. In a changing and dynamic global economy, Haviland’s mission remains constant – to give timely, value-added marketplace insights and foresights.
Leo Haviland has three decades of experience in the Wall Street trading environment. He has worked for Goldman Sachs, Sempra Energy Trading, and other institutions. In his research and sales career in stock, interest rate, foreign exchange, and commodity battlefields, he has dealt with numerous and diverse financial institutions and individuals. Haviland is a graduate of the University of Chicago (Phi Beta Kappa) and the Cornell Law School.
Subscribe to Leo Haviland’s BLOG to receive updates and new marketplace essays.

For several years, in response to the terrifying ongoing international economic crisis, the Federal Reserve Board, European Central Bank, and many other key central banks have played Santa Claus to the global economy in general and debtors (borrowers) in particular. Suppose marketplace stargazers scan the constellation of accommodative Fed policies. These include the blessings of ground level interest rates (Federal Funds) and three sparkling rounds of money printing. The Fed joyously promises to continue offering its bountiful gifts for quite some time!
Not to be outdone, American and other politicians chattering and sometimes laboring in their workshops, engage in massive deficit spending designed to launch and preserve economic recovery.
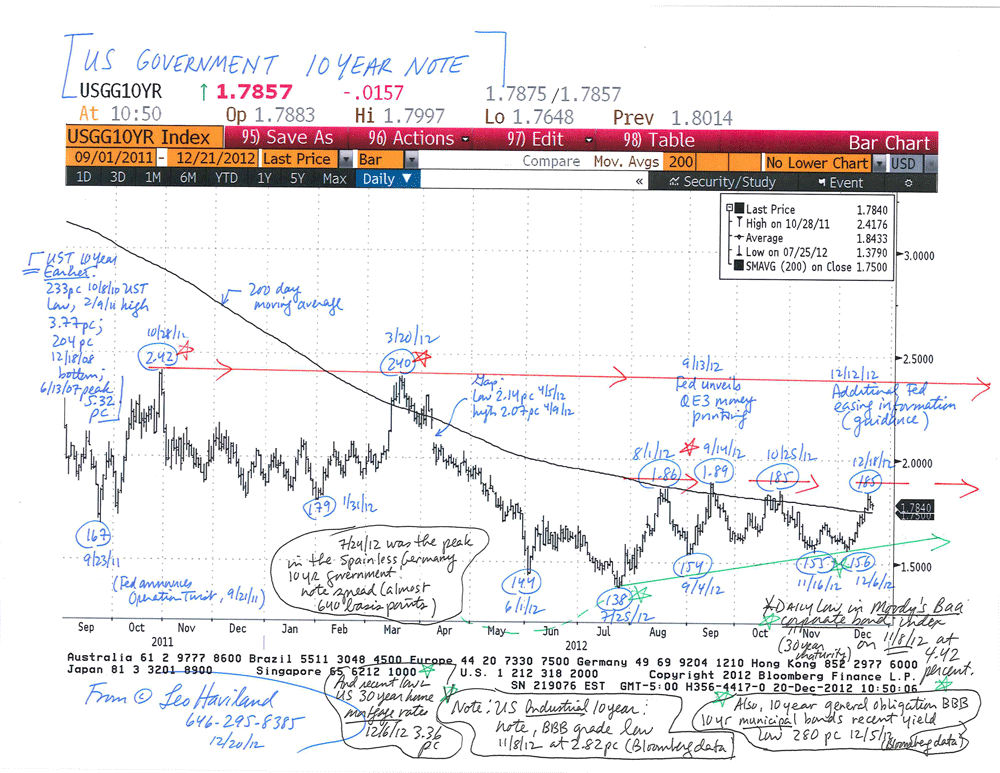
In any event, the UST 10 year note established a major bottom several months ago, at 1.38 percent on 7/25/12. Note that on 12/12/12 the beneficent Federal Reserve not only reaffirmed its two percent long run inflation target, but also indicated it would tolerate inflation projections of 2.5pc for up to two years ahead. Ascending UST rates suggest that the US corporate realm likewise in general will have higher rates.
Take Moody’s Baa index of bonds as a benchmark for US lower quality corporate bonds, yet nevertheless “investment grade”.
Based upon this Baa corporate signpost, US lower quality corporate bond rates have been creeping up lately. They probably established a very significant trough around 4.5 percent in November 2012, or will do so soon. Using daily data (and the extra decimal point) that bottom was 4.42 percent on 11/8/12 (12/18/12 close 4.76pc).
In the US credit arena nowadays, a widening yield spread between lower quality corporate debt and UST might reflect that the hunt for better yields beyond the UST field probably has reached an end.
FOLLOW THE LINK BELOW to download this market essay as a PDF file.
American Yield Quests- US Treasury and Corporate Rates (12-20-12)
US Treasury 10 Year Note Chart (12-20-12)
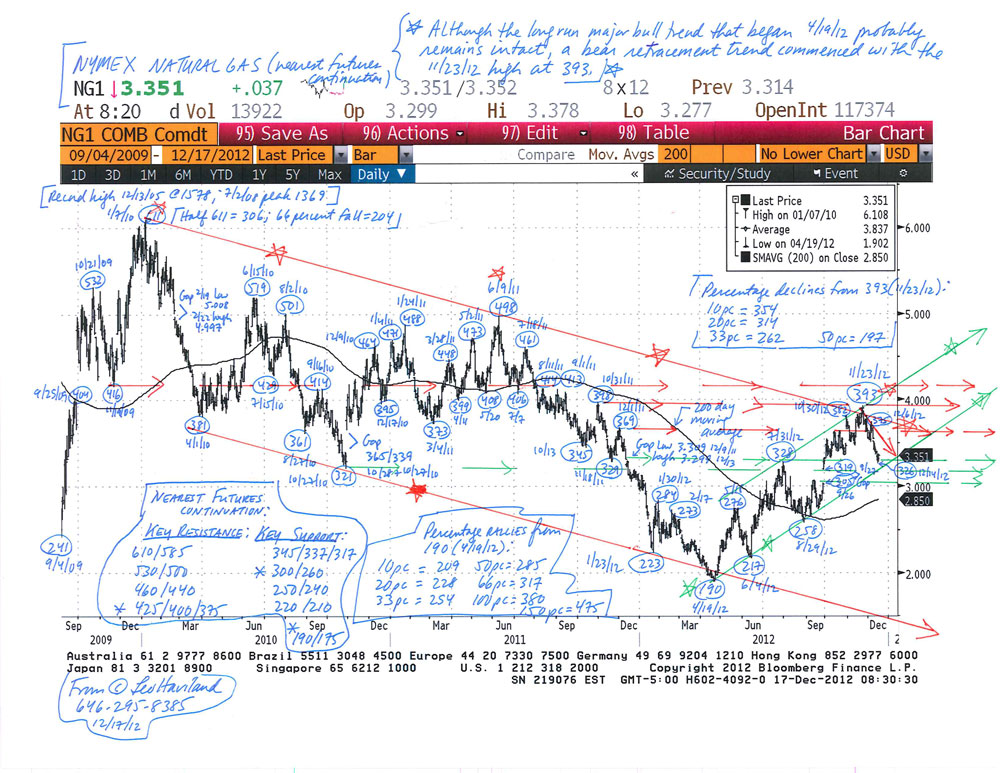
The current bear trend in US natural gas (NYMEX nearest futures continuation basis) that began in late November 2012 at 393 will continue. Assuming normal cold winter weather, the price probably will slump to around the 300 to 285 range. When will the price quit sledding downhill? Though it may only be an initial significant bottom, look for an important low in calendar January or February 2013, probably around futures expiration.
End October 2012 inventories were around 3923bcf according to the EIA barometer (Short-Term Energy Outlook, December 2012; “STEO”). Therefore end October’s 56.3 days of coverage rest about 2.6 days above the 53.7 day long run (1990-2011) average. Though not a big overload relative to that long run average, it is sufficient to place some burden on prices.
Moreover, look at the likely increasing relative oversupply in days coverage terms versus the 1990-2011 average for the given calendar month as time passes from end October 2012 to end March 2013. At end March 2013, forecast inventories of 1873bcf (December STEO, Table 5a) represent about 26.9 days coverage (1873bcf divided by 69.70bcf/d). This jumps about 4.7 days over the 22.2 day long run average for that month, more than October’s 2.6 days.
Suppose end March 2013 inventories are 1800bcf. The excess relative to the long run average is 3.6 days (25.8 less 22.2). This still hovers above the 2.6 day end October 2012 difference.
Despite the ongoing near term downtrend, and absent another very mild winter akin to 2011-12’s, a NYMEX natural gas price collapse close to the 190 abyss of April 2012 (or even the 1/23/12 and 6/14/12 depths near 220) is unlikely.
Based on 2012’s substantial switching from coal to natural gas, particularly in the electric power territory, natural gas demand probably will mount if prices sustain levels beneath (roughly) 275. In addition, another factor probably will mitigate price declines. Concentrate on days coverage holdings in recent years.
The desired level of natural gas inventory holding in recent years arguably has climbed relative to that long run average. Consequently the oversupply of October 2012 through March 2013 probably is less than many observers believe.
FOLLOW THE LINK BELOW to download this market essay as a PDF file.
US Natural Gas in Winter 2012-13- Drawing Conclusions (12-17-12)
Natural Gas Chart (NYMEX nearest futures) (12-17-12)
Petroleum is a key part of the broad GSCI and many other commodity indices. Of course not all commodities travel in the same direction, for they have diverse supply/demand situations. And marketplace timing relationships are not precise; commodities (even within a specific sector such as petroleum) do not all embark in a bull or bear trend at or around the same time. The overall petroleum complex, a key chapter in the commodities in general story, nevertheless has marched more or less alongside the S+P 500.
Each of the assorted petroleum spreads has its own supply/demand variables. Picture a front-to-back intramarket NYMEX crude oil spread or a US Gulf Coast gasoline crack (refining margin) spread. An analytical connection portraying a relationship between petroleum spreads to the S+P 500 and economic recovery (decline) and Federal Reserve policies may seem to be a fairly long stretch.
Yet the price and time movements of one or more important petroleum spreads often “confirm” or warn of changes in outright price trends in the overall petroleum price complex (and its individual marketplaces such as Brent/NSea crude oil, or US Gulf Coast gasoline). So in a web where flat price petroleum patterns generally (roughly) coincide with those of the broad GSCI, trends in oil spreads offer guidance to the broad GSCI trend. Given the rather close bull (and bear) shifts between the GSCI and the S+P 500, petroleum spreads therefore sometimes can offer insight into S+P 500 trends (and into US and international economic growth trends as well). And so Federal Reserve policies tie into some petroleum spread marketplaces. Keep in mind, however, that perceived connections between petroleum spreads and these other domains are only guidelines, and they are not unchanging. Read the rest of this entry »
The major bull charge by the Japanese 10 year government bond (JGB) to lower yields probably ended in late July 2012, or will do so soon. The Japanese Yen’s long run bull trend (effective exchange rate basis, Bank of England data) likewise probably ceased in midsummer 2012.
Four significant inflationary variables have or likely will entangle with the massive Japanese easing to date. First, major central banks around the world via various methods have engaged in extravagant easing. Consider the money printing (QE1, 2, 3), low interest rates, and other accommodative weapons of the United States Federal Reserve. The economic wizards at the Fed have heralded they will not change to a tightening course anytime soon. Don’t forget the European Central Bank’s gradual even if roundabout surrender to easy money principles (especially over the last year). Recall the generous central bankers of China, the United Kingdom, and Switzerland. In the interconnected global economy, the more widespread and sustained the money printing and related policies, the more likely that there eventually will be upward price moves in consumer prices (and similar measures) as well as interest rate increases.
A more specific focus on the Japanese situation reveals the three other considerations. For starters, the Japanese business community (exporters especially) has become extremely upset (not merely worried) by the Yen’s sustained strength. This dismay increased due to a recent noteworthy GDP slump. Business interests (Japan, Inc.) significantly influence Japanese political policies. Second, Japan likely will enshrine a new governing political party after its December 2012 elections. These incoming political leaders apparently seek an even easier monetary policy than presently exists.
The third relates to the towering Japanese government debt and ongoing substantial budget deficits. Most political pundits and marketplace mavens bemoan the looming United States fiscal cliff. Japan, unlike America, wins praise as being a nation of savers (creditors) rather than debtors (borrowers). However, the Japanese government, unlike its citizens, does not incarnate thriftiness.
The current and medium term Japanese fiscal outlook, even without a change in government policies, is no cause for complacency. The Japanese political (economic) establishment, regardless of party, engages in brinkmanship, for it has shown little inclination to subdue that substantial deficit spending and massive and growing government debt. Compare the United States awesome near term and long run federal debt vista. Thus Japan probably already is fairly close to the border of a fiscal crisis. Read the rest of this entry »


 View Leo Haviland’s profile