

GLOBAL ECONOMICS AND POLITICS

Leo Haviland provides clients with original, provocative, cutting-edge fundamental supply/demand and technical research on major financial marketplaces and trends. He also offers independent consulting and risk management advice.

Haviland’s expertise is macro. He focuses on the intertwining of equity, debt, currency, and commodity arenas, including the political players, regulatory approaches, social factors, and rhetoric that affect them. In a changing and dynamic global economy, Haviland’s mission remains constant – to give timely, value-added marketplace insights and foresights.

Leo Haviland has three decades of experience in the Wall Street trading environment. He has worked for Goldman Sachs, Sempra Energy Trading, and other institutions. In his research and sales career in stock, interest rate, foreign exchange, and commodity battlefields, he has dealt with numerous and diverse financial institutions and individuals. Haviland is a graduate of the University of Chicago (Phi Beta Kappa) and the Cornell Law School.


Subscribe to Leo Haviland’s BLOG to receive updates and new marketplace essays.

RSS View Leo Haviland's LinkedIn profile View Leo Haviland’s profile


CURRENCY WARS, DOLLAR AND YEN SLIDES (c) Leo Haviland February 1, 2013

Currency war fears and realities often reflect widespread economic crisis worries. From time to time during the ongoing international economic crisis that emerged in 2007, marketplace wizards and political sages have warned of currency wars. Many such observers label and bemoan currency battles as “bad”, especially if such competitive devaluations involve several key trading nations around the globe. Nevertheless, many countries view devaluation of their home currency (whether “in general”, or in a cross rate against another nation) as “good”, at least so long as such tumbles are “not excessive”. Might depreciation boost exports and thus help to generate the blessings of growth? Or, might depreciation (at least up to some point) reduce the burden of outstanding debt obligations denominated in the home currency? Thus, in some realms (or at least for powerful economic camps within such territories), depreciation (and sustained currency weakness) ironically often is akin to a military victory.

In recent months, the US dollar and Japanese Yen have fallen, the Yen especially dramatically. However, the greenback already was feeble from a longer run historical vantage point, and its erosion has been rather steady since around June 2012. In America, the Federal Reserve and many politicians clearly endorse a relatively weak dollar. Look at the Fed’s massive and sustained money printing and rock-bottom Federal Funds rate. Have American economic generals in recent months been shouting about the merit of a “strong dollar”? The recent Japanese election and political pressures has accelerated the Yen’s weakness that emerged during 2012.

A weak US dollar in recent years often has been associated with bullish moves for US equities (S+P 500). Recent Yen weakness helped to rocket Japanese equities (Nikkei 225) sharply higher from their 6/4/12 (8240) and 10/15/12 (8490) valleys. The Yen’s weakness began from a so- called very strong level, so perhaps its decline will enhance Japan’s economic growth. Will this Japanese expansion, if it occurs, do so at the expense of others? Perhaps.

For the US, the broad real trade-weighted dollar probably will challenge its July 2011 record low depth in the relatively near future. A decisive breach of that bottom would not be surprising. A challenge of the July 2011 low, and therefore a break beneath it, probably would not be bullish for the S+P 500.

FOLLOW THE LINK BELOW to download this market essay as a PDF file.
Currency Wars, Dollar and Yen Slides (2-1-13)
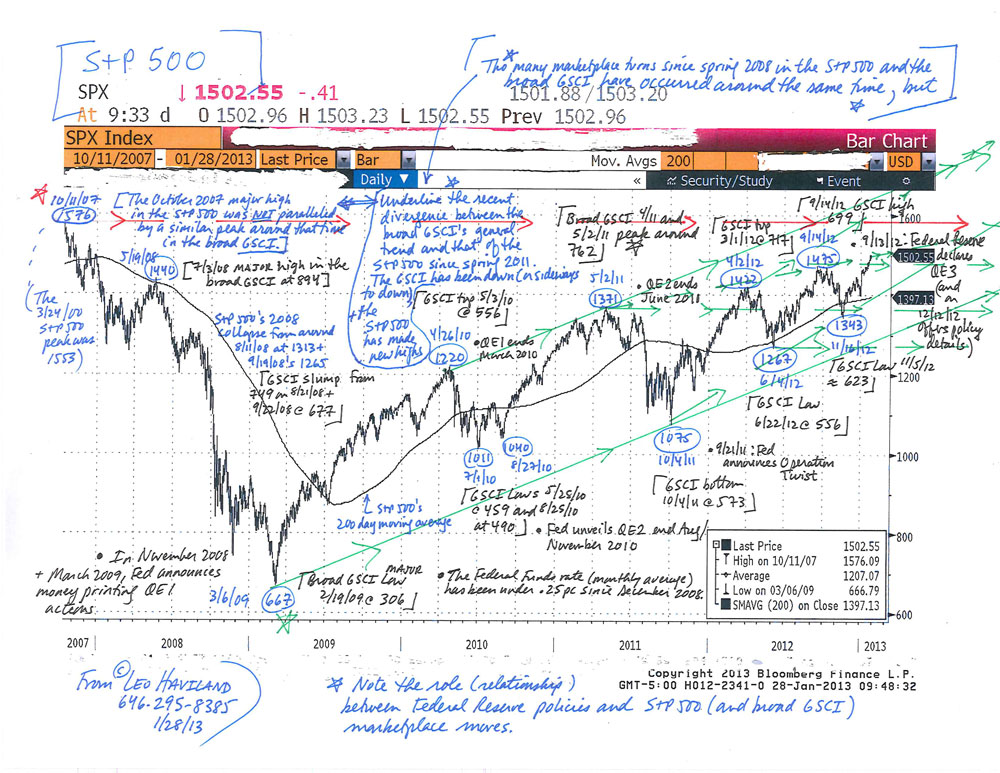
COMMODITIES AND US STOCKS: CONVERGENCE AND DIVERGENCE © Leo Haviland January 28, 2013

Since mid-2008, commodities “in general” and United States stocks “as a whole” have moved roughly in the same direction at around the same time. In this convergence process (relationship), noteworthy bull (bear) moves in US equities find parallels in those in the commodity arena. Thus significant marketplace rallies (declines) have tended to occur around the same time.

However, this perspective is not the only vantage point by which to assess the often close relationship between US equities and the commodities complex. There also is another, longer run view by which one can examine the relationship between them. Since spring 2011, commodities have ventured down (or sideways to down). However, key American stock benchmarks such as the S+P 500 have attained new highs, first in April 2012, then September 2012, and again in January 2013. Thus despite the convergence at assorted timely turning points since spring/ summer 2008, and even though the two territories continue to trade together to some extent, arguably there has been noteworthy divergence in their overall relationships (their trends) since May 2011.

Now recall several of 2007-08’s details. US equities peaked in October 2007, almost nine months before the commodity one in early summer 2008. Only after the final stock marketplace

summit in May 2008 did equities and commodities trade in close tandem. The current longer run relationship thus perhaps likewise reveals divergence, but with the commodity peak to date appearing well before any major S+P 500 one.

In contrast to 2007-08, what if the major peak in commodities is well before that in stocks (and the lag is likewise so great as to suggest divergence)? Suppose- and this admittedly is a key suppose- eventually commodities and US stocks will trade together over the long run. After all, so-called marketplace relationships can change dramatically, whether from the convergence/ divergence (lead/lag) perspective or otherwise. What does continued divergence, the failure of commodities to near or exceed its spring 2011 heights, suggest?

The 2007-08 relationship warns that the current continued failure of commodities to confirm the equity rally eventually will reveal a notable decline in stocks. Since the duration between the spring 2011 commodities top and today’s new highs in the S+P 500 is almost 20 months, whereas that between October 2007’s stock pinnacle and the broad GSCI’s summit in July 2008 was about nine months, the failure of the broad GSCI to achieve new heights should warn equity bulls that a decline may be fairly near in time.

S+P-500-Chart-(1-28-13,-for-essay-on-Commodities-and-US-Stocks)

FOLLOW THE LINK BELOW to download this market essay as a PDF file.
Commodities and US Stocks- Convergence and Divergence (1-28-13)
S+P 500 Chart (1-28-13, for essay on Commodities and US Stocks)

US NATURAL GAS- OFF IN THE DISTANTS © Leo Haviland, January 14, 2013

In commodity marketplaces, the price level and fluctuations of the spot (physical, cash) world and nearby (front) months generally attract and fascinate us more than periods (distant month contracts) out in the seemingly more misty future. In recent history, bull and bear moves in distant period NYMEX natural gas contracts to a substantial extent have mirrored those in the nearby months. Patterns in NYMEX natural gas strips, whether seasonal ones such as summer 2013 or calendar years such as 2014, 2015, and 2016, significantly resemble those of actual nearby months (and the nearest futures continuation contract perspective). For example, after marching upward and achieving peaks in spring 2011, they eventually fell off together, reaching dismal valleys in April 2012. The front months and distant spans then ascended dramatically, although not exactly the same distance. After this climb, they began to retreat together; recall the descent since late November 2012 (some trading periods started to fall off in price in October). The nearby and distant month trends thus have generally “confirmed” each other.

Nevertheless, any given natural gas near term situation is not always or necessarily the same as that of the more distant future (or ancient history) times. Because natural gas is not a cost of money commodity like gold, this similar directional relationship between spot (and front month) and forwards off in the distance is neither unchanging nor guaranteed. Some divergence may develop. Therefore marketplace players should monitor trends in NYMEX distant month natural gas contracts in addition to those of actual nearby months (and first futures continuation).

The long run major bull trend of the NYMEX natural gas complex that began in April 2012 (as represented by the nearest futures continuation bottom around 190 on 4/19/12) remains intact. However, at present the near term bearish retracement move for both nearby as well as distant month forwards such as the summer 2013 strip and the calendar strips of more faraway years also likely remains in place. See the nearest futures continuation high on 11/23/12 at 393.

The interim decline in natural gas that commenced during fourth quarter 2012 probably is near in time to at least an initial end. Assuming normal winter weather, the most likely time for this bearish NYMEX natural gas pattern to cease is in late calendar January or late calendar February 2013 (probably around nearest futures expiration). In any event, the price (nearest futures continuation basis) will not easily sustain falls beneath the 300 to 285 range (note recent lows on 1/2/13 at 305 and 1/9/13 at 309). Warmer than normal weather (as in last winter) could postpone the low (recall the late April 2012 depth). Given the likelihood of above normal US natural gas inventories in days coverage terms, there remains a significant chance of a final (second, double) bottom in late August or calendar September 2013.

As there are regional differences (basis relationships) between natural gas marketplaces, players should not restrict this comparative approach to NYMEX natural gas. Why not analyze near term relative to far out periods natural gas at a variety of different locations (and review related basis relationships over these vistas)? Also, given the links between natural gas and electricity fields, analysis of electricity marketplaces in more distant months in a given region offers insight into near term electricity trends as well as distant month (and even near term) natural gas battlegrounds.
Read the rest of this entry »

NORTH SEA CRUDE OIL OUTPUT: PERSPECTIVES AND PRICE CONSEQUENCES © Leo Haviland, January 3, 2013

For over a decade, and notably since the mid-2000s, OECD Europe crude oil production has slumped as a percentage of worldwide petroleum output. The majority of that European output issues from the North Sea. More importantly, yearly average European crude oil production has

plummeted over that span. North Sea production includes a key international crude oil price benchmark, Brent and related other offshore crude streams.

North Sea/Brent does not merely capture trader attention and spark media headlines. Despite its diminishing physical supply role as a share of global production, despite its sharp absolute production drop, North Sea/Brent’s marketplace power nevertheless is very important and extends around the globe. Why? The petroleum industry continues to price many other crude oils directly or indirectly relative to it. North Sea/Brent has a greatly disproportionate influence on global crude oil pricing relative to its output.

Moreover, not only has the barrel per day output of North Sea/Brent declined in recent years. Demand for the “high quality sweet” grades it represents remains substantial.

Consequently, all else equal, North Sea/Brent (“Brent”) crude oil supply in recent years generally has become tight (low “free supply”). So all else equal, since Brent acts as a price guide for other crudes, its supply/demand situation thereby tends to boost global crude oil prices to and sustain them at “high” (or “relatively high”) levels.

Brent’s bottom at the depth of the worldwide economic crisis was $36.20 per barrel (12/24/08). Although it peaked 3/1/12 at 12840 (making a double top alongside the 4/11/11 and 4/28/11 plateaus around 12700), at over 11000 it still remains quite high.

In 2000, European crude oil production was about 6.8mmbd, nearly equal to 1996’s 6.7mmbd. By 2004, it eroded to 6.1mmbd. European oil output represented 9.2 percent of world supply in calendar 1996, 8.8pc in 2000, and 7.3pc in 2004.

Since 2004, European output continued its steady and sharp descent, as did its share of total world oil production. In 2005 it was 5.7mmbd (6.7pc of global supply), with 2006 at 5.3mm (6.2pc), 2007 five mmbd (5.8pc), and 2008 4.8mmbd (5.5pc).

In 2009, it was 4.5mmbd (5.3 percent). In 2010, it was only 4.1mmbd (4.7pc), with 2011’s down even further to 3.8mmbd (4.3 percent of 88.4mmbd). The IEA estimates 2012 at 3.4mmbd, down about 50 percent from the 1996/2000 heights and merely 3.7pc of global production about 90.8mmbd (assume 4Q12 supply stood around that of the prior three quarters).

Not only has Brent long been a major international benchmark crude oil. Arguably its guiding influence on petroleum pricing has grown in recent years.

Compare the secular decline in North Sea crude oil output with recent US crude oil production trends. America’s long-run crude oil production tumble ended around 2008. Read the rest of this entry »
