GLOBAL ECONOMICS AND POLITICS
Leo Haviland provides clients with original, provocative, cutting-edge fundamental supply/demand and technical research on major financial marketplaces and trends. He also offers independent consulting and risk management advice.
Haviland’s expertise is macro. He focuses on the intertwining of equity, debt, currency, and commodity arenas, including the political players, regulatory approaches, social factors, and rhetoric that affect them. In a changing and dynamic global economy, Haviland’s mission remains constant – to give timely, value-added marketplace insights and foresights.
Leo Haviland has three decades of experience in the Wall Street trading environment. He has worked for Goldman Sachs, Sempra Energy Trading, and other institutions. In his research and sales career in stock, interest rate, foreign exchange, and commodity battlefields, he has dealt with numerous and diverse financial institutions and individuals. Haviland is a graduate of the University of Chicago (Phi Beta Kappa) and the Cornell Law School.
Subscribe to Leo Haviland’s BLOG to receive updates and new marketplace essays.

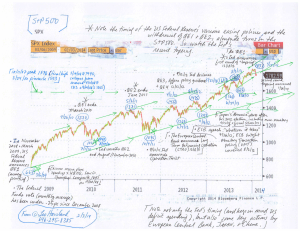
Yet during the darkest days of the worldwide economic crisis of late 2008/early 2009 as well as during the subsequent recovery, Federal Reserve Board easy money policies have played key roles in encouraging bull moves in the S+P 500 (and many other equity playgrounds). Likewise, the elimination of some of these schemes, particularly previous rounds of quantitative easing (money printing), has occurred alongside highs in American stock benchmarks.
What does tapering foreshadow? The Fed’s recent decision to reduce (taper) and eventually eliminate the current gigantic round of money printing warns that a notable top is or relatively soon will be in place. Thus the mid-January 2014 high point in the S+P 500 arguably represents an important top. If a stock marketplace peak is not currently in place, one probably will be by around the end of first quarter 2014. Several other indicators likewise portend a plateau in the S+P 500. Fed tapering, to the extent it coincides with at least a modest decline in the S+P 500 and related indices, will hint that economic growth in America, other advanced nations, and developing and emerging countries will be less than predicted by guardians such as the International Monetary Fund.
FOLLOW THE LINK BELOW to download this market essay as a PDF file.
US Stocks- Shadows and Signals (2-3-14)
Chart- S+P 500 (2-3-14, for essay US Stocks- Shadows and Signals)
In the current environment, many central bankers in so-called advanced nations such as the US, Europe, Japan, and the United Kingdom (and in many other places around the globe) have adopted an inflation ideology. The IMF’s leading light heralds in her speech: “With inflation running below many central banks’ targets, we see rising risks of deflation, which could prove disastrous for the recovery. If inflation is the genie, then deflation is the ogre that must be fought decisively.” For OECD-type (advanced) countries, one can summarize the current version of that beloved doctrine: “moderate inflation of around two percent is good, lower than that is not very good (or maybe even a little bit bad), and deflation is definitely bad.” It is unclear how much inflation (in the opinion of marketplace generals these days) would be inappropriate (bad), but arguably over five percent on a sustained basis definitely would be bad (evil; monstrous).
Suppose worldwide deflationary forces remain very significant. Perhaps credit (and debt) and leverage problems developed during the Goldilocks Era (and probably during quite a few years before then) have not been solved. Suppose the worldwide economic crisis that emerged in 2007 and accelerated in 2008 did not create sufficient deflation to remedy the inflationary issues previously built up. Then lax monetary policy at best (even if accompanied by substantial deficit spending) may create mediocre real economic growth, generate less than desired (sufficient) inflation, and only modestly improve the dismal unemployment picture.
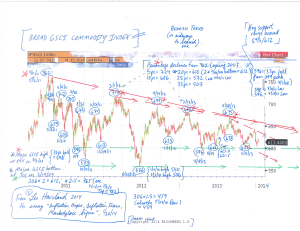
The trends of recent years show declines in real US median (and mean) income. Commodities have been in a downtrend since their peaks in spring 2011. Of course commodities are only one part of consumer price indices. And wages and incomes are not the same as consumer prices. Yet these trends in US income and the broad GSCI indicate that “inflation in general” (including such measures as the consumer price index, PCE, and GDP deflator) is strongly entrenched at low levels. In addition, unless the Fed and other central banks embark on even more massive easing than they have done thus far, this income and commodity evidence (especially when interpreted alongside the low rates of CPI-type inflation) suggests that it probably will be very difficult for “inflation in general” to rise much if at all from current low levels. And “very low” inflation (or even deflation) eventually may appear outside of the real income and commodity territories (especially if US and related interest rates leap higher).
In any event, the US income statistics and broad GSCI bear trend indicate that despite all the Fed (and other central bank) easing, the creation of sustained “sufficient” consumer price (or PCE) inflation remains a huge challenge. Given the intertwining of inflation policies and phenomena (and forecasts) with those of real GDP and unemployment, these notable wage and commodity trends hint that real GDP increases probably will be less than regulators and politicians (not just in the US) aim for, and that unemployment probably will not fall as much as desired.
FOLLOW THE LINK BELOW to download this market essay as a PDF file.
Inflation Hopes, Deflation Fears, Marketplace Signs (1-20-14)
Chart- Broad GSCI (for essay, Inflation Hopes, Deflation Fears…) (1-20-14)
The broad range for natural gas (NYMEX nearest futures continuation) over the medium term (extending beyond the balance of this winter 2013-14) remains roughly 280/310 to 490/520. Many players view “around 350” as a near term equilibrium price. Why is there substantial support around 300? Note the 305 low on 1/2/13 (and the gap relative to the 3.046 high on 9/26/12), the 313 lows of 2/15/13 and 8/8/13, and that a 33 percent fall from the 453 high is about 302.
But what about gas prices specifically for the balance of winter 2013-14? Assuming normal weather and moderate American economic growth, the natural gas trend for the remainder of the current draw season probably is about 340 to 453 (the 12/23/13 top; the 5/1/13 high was 444). Inventory from the days coverage perspective has fallen sufficiently to support prices at higher levels than the longer run 280/310 bottom. Around 338 was the 11/5/13 rally take-off point; 340 is a 25pc tumble from the 453 high.
The current low days coverage level of gas inventory nevertheless implies a warning that a break above the December 2013 summit is not out of the question. Suppose (even if this is relatively unlikely) the US suffers through colder than normal weather for the rest of winter 2013-14, and that overall inventories consequently decline significantly relative to average trends. A five percent break over the December 2013 high gives about 476, a 10pc one 499 (498 was the 6/9/11 high. Recall 2010’s 6/16/10 top at 520 and 8/2/10’s around 501; a 50pc rally from the 11/5/13 point is about 507. If severely cold weather is sustained for a rather long time, then six dollars or higher may ensue, even if only on a brief spike. Keep in mind 1/7/10’s 611 pinnacle.
FOLLOW THE LINK BELOW to download this market essay as a PDF file.
US Natural Gas- a Winter’s Tale (1-12-14)
The lofty pinnacle created around 611 four years ago (1/7/10; NYMEX nearest futures continuation) is a distant memory for many marketplace visionaries. So are much higher price peaks prior to this. Especially since mid-2011, US natural gas production jumped due to the shale gas revolution as well as output associated with the petroleum drilling boom. This has built confidence that ample natural gas supplies generally will keep prices fairly subdued. Allegedly inevitable North American liquefied natural gas exports will not become sizable for at least another two or three years from now. Forecast US electricity demand for calendar 2014 is essentially flat relative to 2013. The NYMEX natural price (nearest futures continuation) even fell under two dollars two years ago (190 bottom; 4/19/12)! Recall the important resistance established this spring at 4.444 (on 5/1/13; challenged but not broken by the recent high on 12/13/13 at 4.443). So how on earth could the front month NYMEX price eventually (even if not this winter) ever sustain itself over 450, or even fly up to 500, 600, or even higher?
Yet inventory obviously still matters. History shows that weather can slash working gas inventories in the Producing Region and elsewhere, sometimes dramatically. Thus despite widespread faith in growing production and other supply/demand variables, high or even average national inventories, particularly from the days coverage perspective, are not guaranteed. Consequently if overall US inventories plummet far enough, and even if this is relatively unlikely (as of now) for winter 2013-14, five or six dollars (and yes, even higher) NYMEX prices are not inconceivable.
In addition, alternative “investment” in commodities has reduced the amount of “free supply” in natural gas. This buy-and-hold for the long run activity probably has been more of a factor since around 2003 (or at least 2006) than in the preceding time span. In any event, for any given arithmetical or days coverage gas inventory level nowadays, such investment makes stocks tighter than they appear, though experts can debate how much. “Speculative” buying enthusiasm also may rally prices.
FOLLOW THE LINK BELOW to download this market essay as a PDF file.
US Natural Gas Inventory- the Producing Region Drawing Board (12-16-13)


 View Leo Haviland’s profile