GLOBAL ECONOMICS AND POLITICS
Leo Haviland provides clients with original, provocative, cutting-edge fundamental supply/demand and technical research on major financial marketplaces and trends. He also offers independent consulting and risk management advice.
Haviland’s expertise is macro. He focuses on the intertwining of equity, debt, currency, and commodity arenas, including the political players, regulatory approaches, social factors, and rhetoric that affect them. In a changing and dynamic global economy, Haviland’s mission remains constant – to give timely, value-added marketplace insights and foresights.
Leo Haviland has three decades of experience in the Wall Street trading environment. He has worked for Goldman Sachs, Sempra Energy Trading, and other institutions. In his research and sales career in stock, interest rate, foreign exchange, and commodity battlefields, he has dealt with numerous and diverse financial institutions and individuals. Haviland is a graduate of the University of Chicago (Phi Beta Kappa) and the Cornell Law School.
Subscribe to Leo Haviland’s BLOG to receive updates and new marketplace essays.

The Federal Reserve Board, other central banks, and numerous marketplace promoters may have encouraged significant complacency in many trading arenas. However, they of course have not abolished marketplace risk.
In several major government note marketplaces- and despite ongoing interest rate repression by the Fed, the ECB, and others- long term yields have floated higher since summer 2012. Interest rates began ascents in America, Germany, and China. Major bear trends are underway and intertwined in these three countries. Even Japan since spring 2013 has shown signs of higher rates, although its enormous bond buying program may keep its 10 year JGB low.
In any case, higher inflation helps to boost interest rates. So keep in mind the determination of the Fed, the ECB, and the Bank of Japan to achieve around two percent inflation, as well as China’s long-running lax credit policies.
The Fed repeatedly tells audiences that inflation expectations are well-anchored at low levels. Rate increases should make observers wonder about the durability of this anchor, especially given the Fed’s long-running deluge of money printing.
History nevertheless displays that significant US government yield rises sometimes precede (“lead”) important American stock price bear moves. The sustained increase in US 10 year government note yields since July 2012 arguably is leading to a decline in the S+P 500 (admittedly this leading process is taking quite a long time). A decisive and sustained march in the 10 year UST through its three percent barrier probably will be bearish for the S+P 500 (and many other stock marketplaces). In addition, keep in mind the ongoing bear trends in emerging stock marketplaces “in general” and in the “overall” commodities marketplace that started in spring 2011.
FOLLOW THE LINK BELOW to download this market essay as a PDF file.
Marketplace Yields- the Right of Way (12-16-13)
Although China’s economy of course differs from those of other major nations around the globe, it intertwines with them. However, China’s huge debt securities marketplace receives relatively little attention from traders, analysts, and the media in comparison to those of the United States, the Euro Area, and Japan.
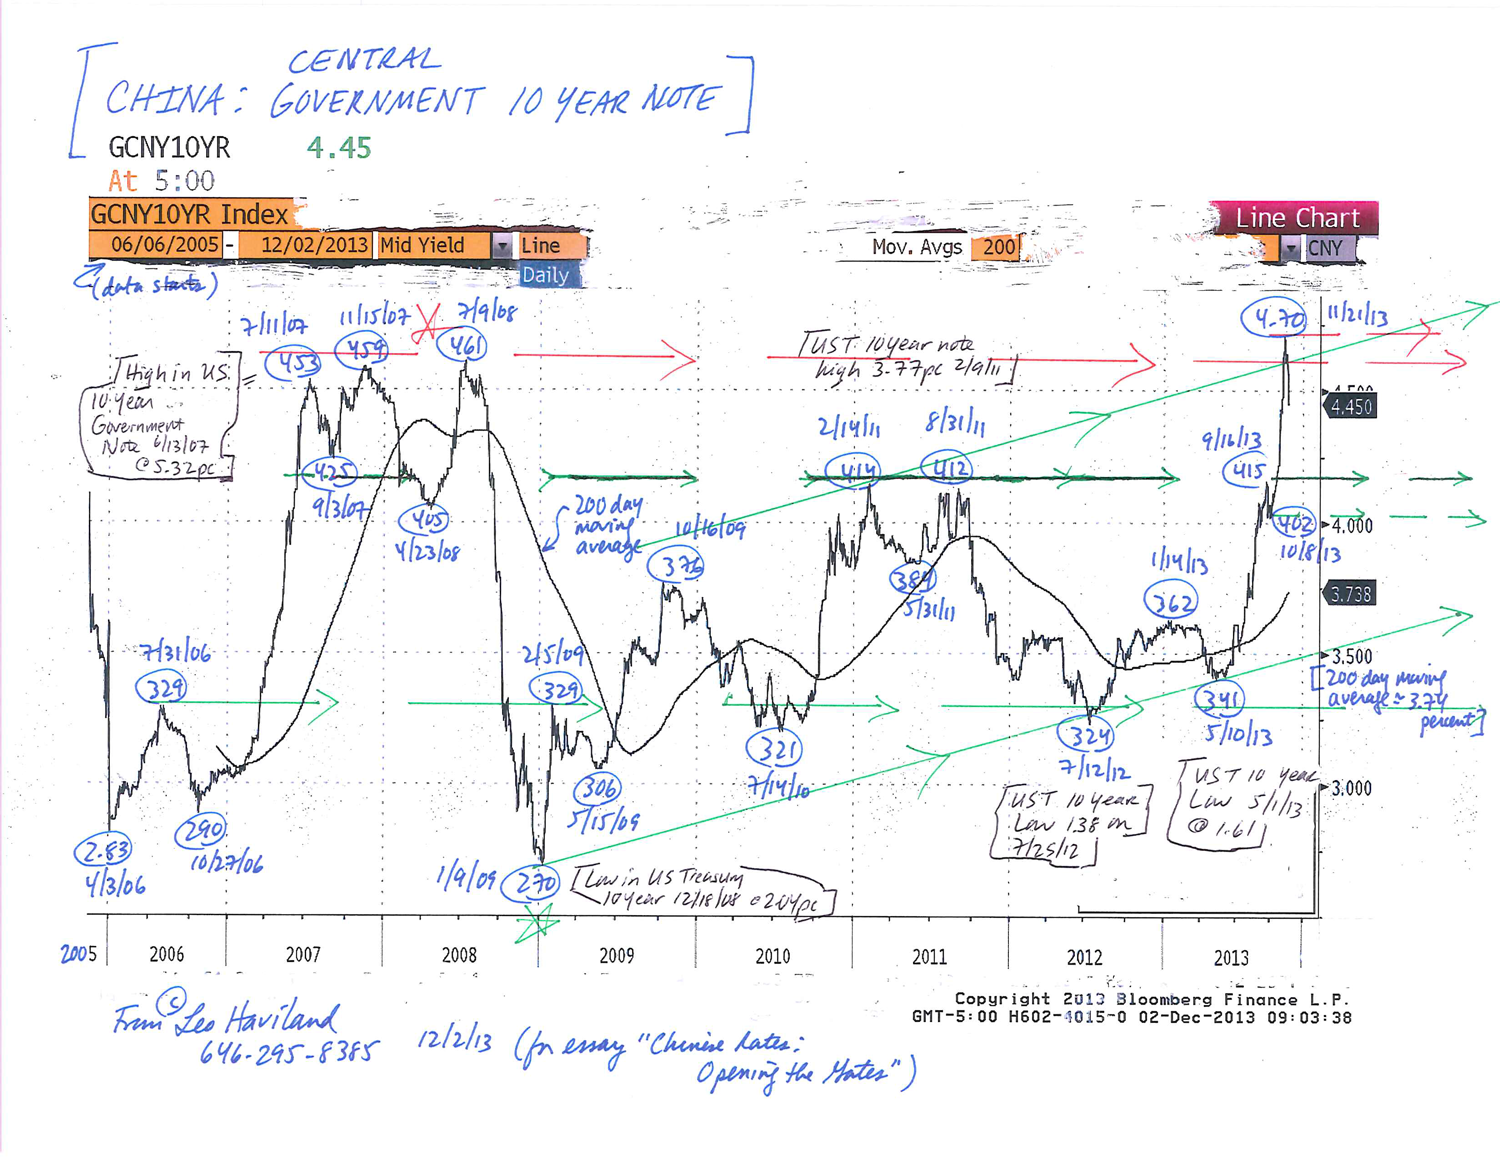
Debt, stock, currency, and commodity marketplace observers concentrating on matters such as Federal Reserve Board policy and the S+P 500’s level and trend should extend their vision to include Chinese interest rates. China’s 10 year government note, after establishing bottoms at 3.24 percent on 7/12/12 and 3.41pc on 5/10/13, has raced higher. After a brief stop at 4.02pc on 10/8/13, the note decisively crashed through 2011’s 4.10pc barrier, recently breaking through 2007-08’s wall around 4.60pc to reach its recent high of 4.70pc on 11/21/13. The one year government note yield likewise has ascended significantly. Chinese government interest rates probably will continue to climb higher.
Near-universal optimism reigns regarding China’s economic situation and prospects. Even if the national economy is relatively robust, it may be less so than many believe.
Given China’s obvious importance to the world economy, a greater than expected slowdown in the marvelous Chinese growth rate, in part due to sustained higher yields, probably would entangle with and undermine recovery prospects in other territories. Moreover, since the end of the joyous Goldilocks Era and during the dreadful international economic crisis and the subsequent recovery, many turning points in the 10 year Chinese government note have occurred around the same time as those in benchmark 10 year US Treasury and German government notes. Thus despite the yield repression policy tightly embraced by the Federal Reserve and its central banking allies, the notable ascent in Chinese government interest rate yields underlines that the overall long run trend for yields in most key nations is probably higher.
FOLLOW THE LINK BELOW to download this market essay as a PDF file.
Chinese Rates- Opening the Gates (12-2-13)
Chart- Chinese Government 10 Year Note (for essay, Chinese Rates- Opening the Gates) (12-2-13)
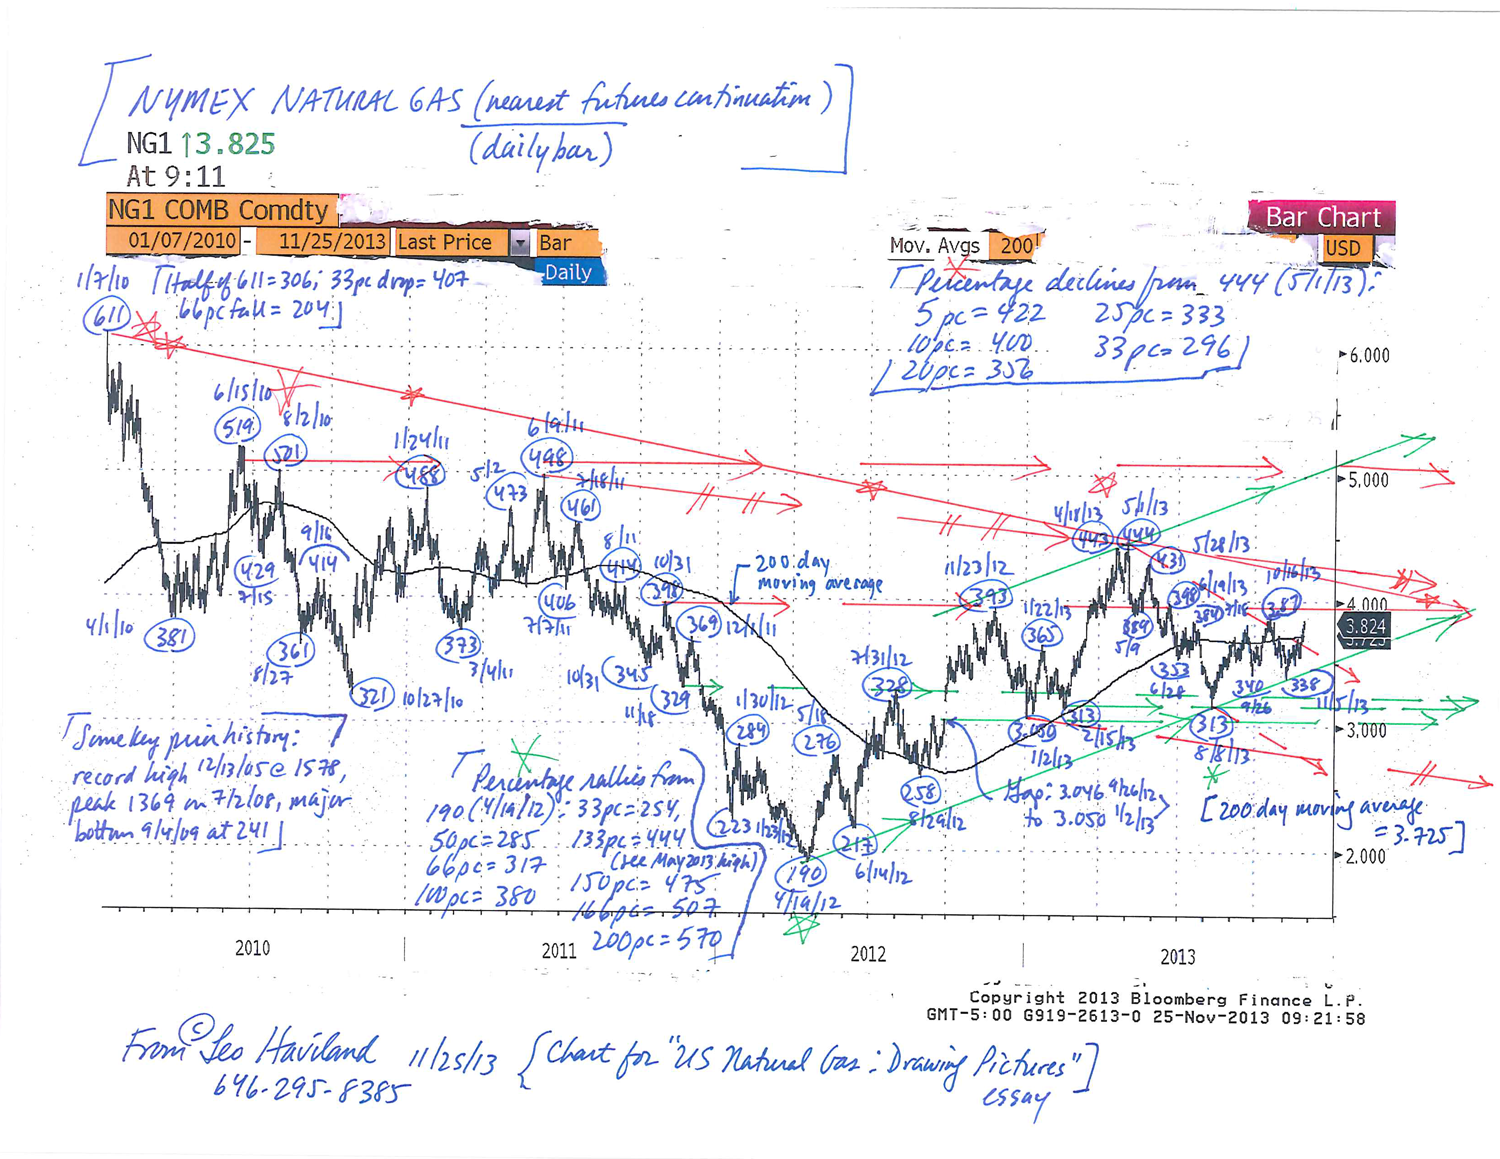
Over the winter 2013-14 time horizon, assuming normal weather and moderate American economic growth, the natural gas trend probably remains sideways (NYMEX nearest futures continuation). The broad range for natural gas stands from roughly 280/310 to 490/520. Many players view “around 350” as a near term equilibrium price. The 5/1/13 summit at 444 also represents important resistance.
What does the US lower 48 states working gas inventory picture unveil regarding potential price moves? Much depends on the perspective embraced regarding what constitutes average (appropriate, normal, reasonable, typical, usual) inventory levels. One factor in this regard is the historical time horizon selected. And although arithmetic inventory totals are important, observers especially should focus on the days of inventory coverage variable. After all, changing consumption levels influence industry viewpoints regarding what constitutes average, high, or low stockpiles.
Although the long run 1990-2012 vista should not be overlooked, suppose the 2006-12 horizon is more relevant for inventory analysis. Then end October 2013 natural gas inventories, despite being high in arithmetical (bcf) terms, arguably are slightly below average. Admittedly this conclusion probably is not a mainstream view. After all, most players and soothsayers devote their attention to arithmetic rather than days coverage history. In addition, assuming normal weather, natural gas stocks at the end winter 2013/14 draw season probably will be only slightly high relative to average in days coverage terms rather than moderately above average. Given this greater emphasis on the 2006-12 era, and despite the bearish supply/demand outlook for full year 2014, prices should hold above the 280/310 support band, with a test of 400 unsurprising.
With the 2006-present days coverage perspective in mind, given end build season 2013 inventories, what are price prospects if this winter is notably colder or warmer than average? A sustained move over 400 probably requires a somewhat colder than average winter (or widespread faith that such temperatures will occur). To challenge spring 2013’s top, probably a significantly colder than normal winter is necessary. But what if major inventory drawdowns in days coverage terms occur? The marketplace could climb toward and even briefly venture north of 490/520. Conversely, to sustain moves under the 280/310 floor, warmer than usual US temperatures in the key consumption regions must emerge and continue. Important support exists around the 305/310 first quarter 2013 level; note the 313 trough on 8/8/13 following the 5/1/13 peak.

FOLLOW THE LINK BELOW to download this market essay as a PDF file.
US Natural Gas- Drawing Pictures (11-25-13)
Natural Gas Chart (NYMEX nearest futures, for US Natural Gas- Drawing Pictures essay) (11-25-13)
Nevertheless, although the Euro Area “in general” is not entirely out of gas and running on empty, it is running in place. Its economic performance for the next few years probably will be sluggish. There will be little or no economic growth, general government debt will remain quite high, and unemployment will stay very lofty.
The Eurozone economy is going nowhere fast on the road to recovery. Of course differences between individual nations exist; Germany is not Greece.
For the stock arena, take the SXXP index of 600 European stocks (though it includes United Kingdom and other non-Euro Area companies) as a benchmark (Bloomberg symbol is SXXP). This vehicle, like America’s S+P 500, has not moved in a sideways pattern, but instead has (despite some sharp twists and turns) flown sky-high since its 3/9/09 major low at 155.4 (S+P 500 major trough 3/6/09 at 667). The bottom line is that the probable path of European equities probably is closely bound with that of American stocks.
With the SXXP now around 325.0, what’s the rundown on some SXXP levels to monitor? Recall 332.9, the 5/19/08 high. The final top in the S+P 500, after its 10/11/07 pinnacle at 1576, also occurred 5/19/08 (at 1440). If prices fall from current levels, note that twice the 3/9/09 bottom is 310.8; keep an eye on 2/18/11’s 292.2 if prices stumble further. Unlike the S+P 500, the SXXP has not escaped above its 2007 peaks. Are prices for European equities circling back to their former record heights? In any event, if European stock prices venture even higher from current levels, watch 10/11/07’s summit at 391.3 and the major pinnacle of 401.0 on 7/13/07.
FOLLOW THE LINK BELOW to download this market essay as a PDF file.
Eurozone- Running in Circles (11-18-13)
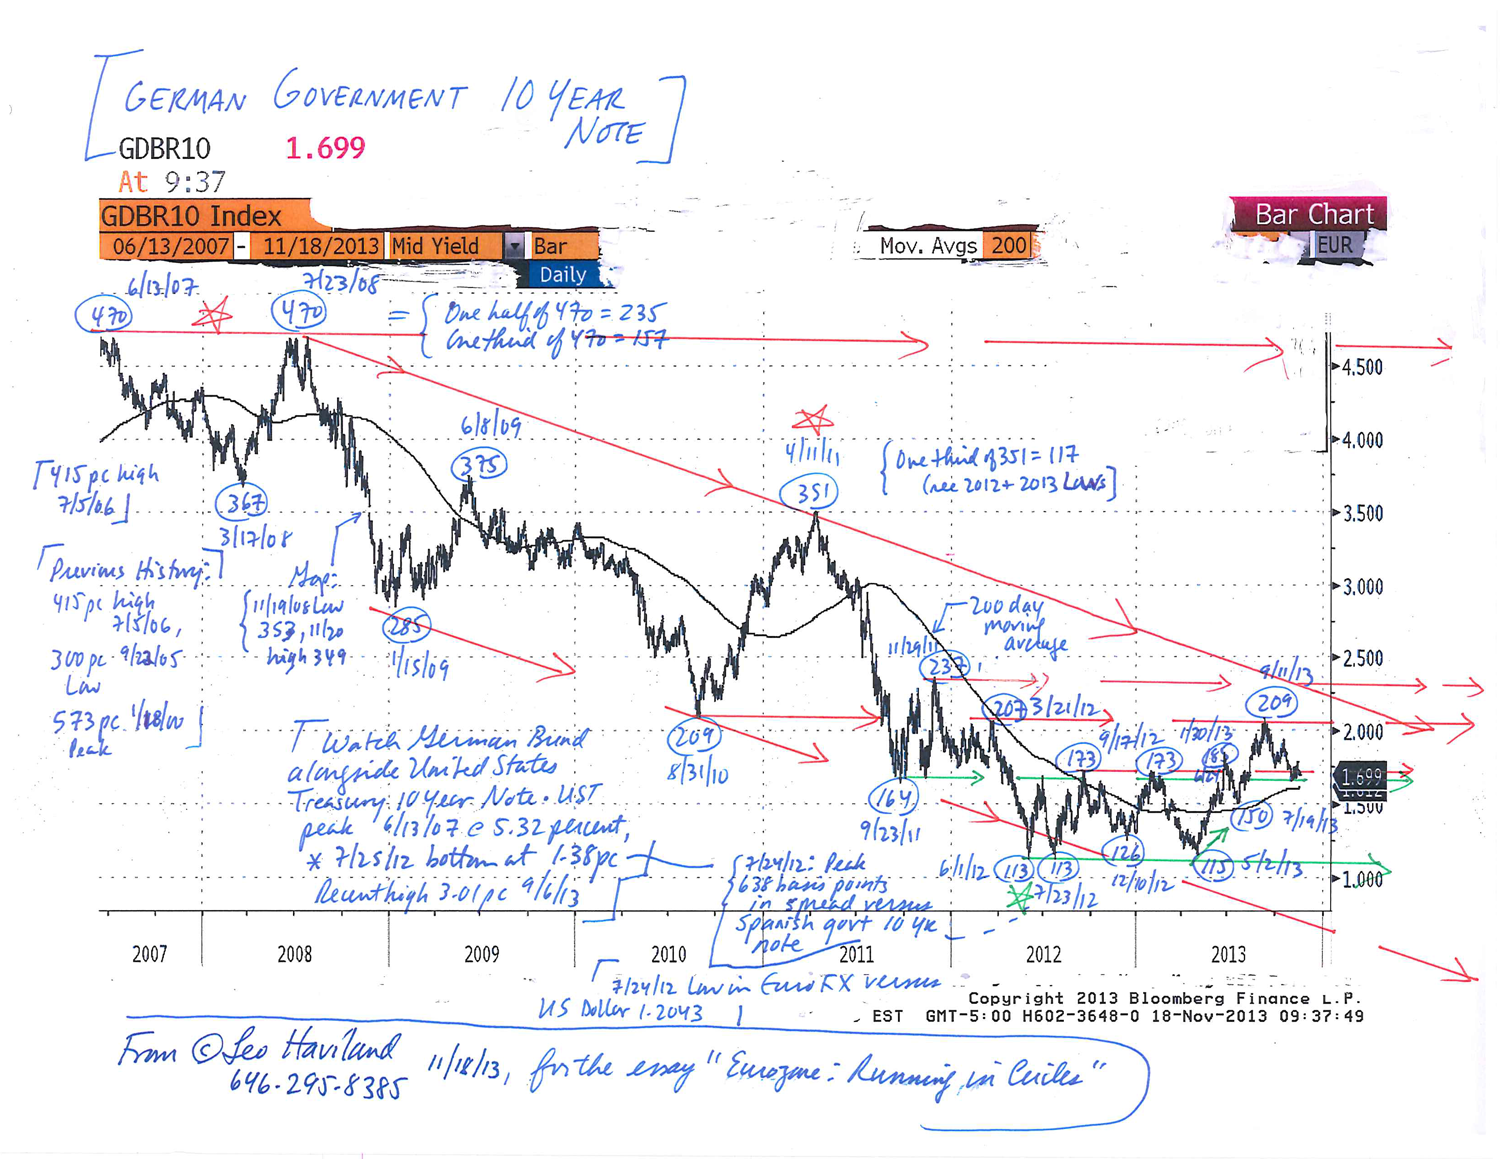
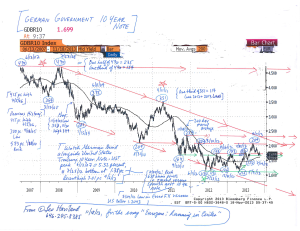
Chart- German Govt 10 Year Note (for essay, Eurozone- Running in Circles) (11-18-13)


 View Leo Haviland’s profile