GLOBAL ECONOMICS AND POLITICS
Leo Haviland provides clients with original, provocative, cutting-edge fundamental supply/demand and technical research on major financial marketplaces and trends. He also offers independent consulting and risk management advice.
Haviland’s expertise is macro. He focuses on the intertwining of equity, debt, currency, and commodity arenas, including the political players, regulatory approaches, social factors, and rhetoric that affect them. In a changing and dynamic global economy, Haviland’s mission remains constant – to give timely, value-added marketplace insights and foresights.
Leo Haviland has three decades of experience in the Wall Street trading environment. He has worked for Goldman Sachs, Sempra Energy Trading, and other institutions. In his research and sales career in stock, interest rate, foreign exchange, and commodity battlefields, he has dealt with numerous and diverse financial institutions and individuals. Haviland is a graduate of the University of Chicago (Phi Beta Kappa) and the Cornell Law School.
Subscribe to Leo Haviland’s BLOG to receive updates and new marketplace essays.

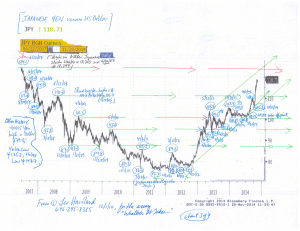
The Euro FX and Japanese Yen for several months have been weakening together, both against the US dollar and on an effective exchange rate basis. This currency relationship and bear trend will continue. Despite the Eurozone’s and Japan’s brave quests to create sufficient inflation (escape deflation), their success probably will be limited; inflation and longer term government interest rates probably will not sustain significant increases. However, even if substantial currency depreciation and massive money printing manage to achieve an inflation goal (and higher interest rates), they likely will not generate sustained economic growth.
Given that both the Eurozone and Japan suffer from low growth and deflationary challenges and fears, is weakness in the Euro FX connected with (encouraging that of) the Japanese Yen? Is the Yen’s swoon helping to depreciate the Euro FX? Are Japan and the Eurozone (and other nations) engaged in competitive devaluations (currency wars) to bolster growth?
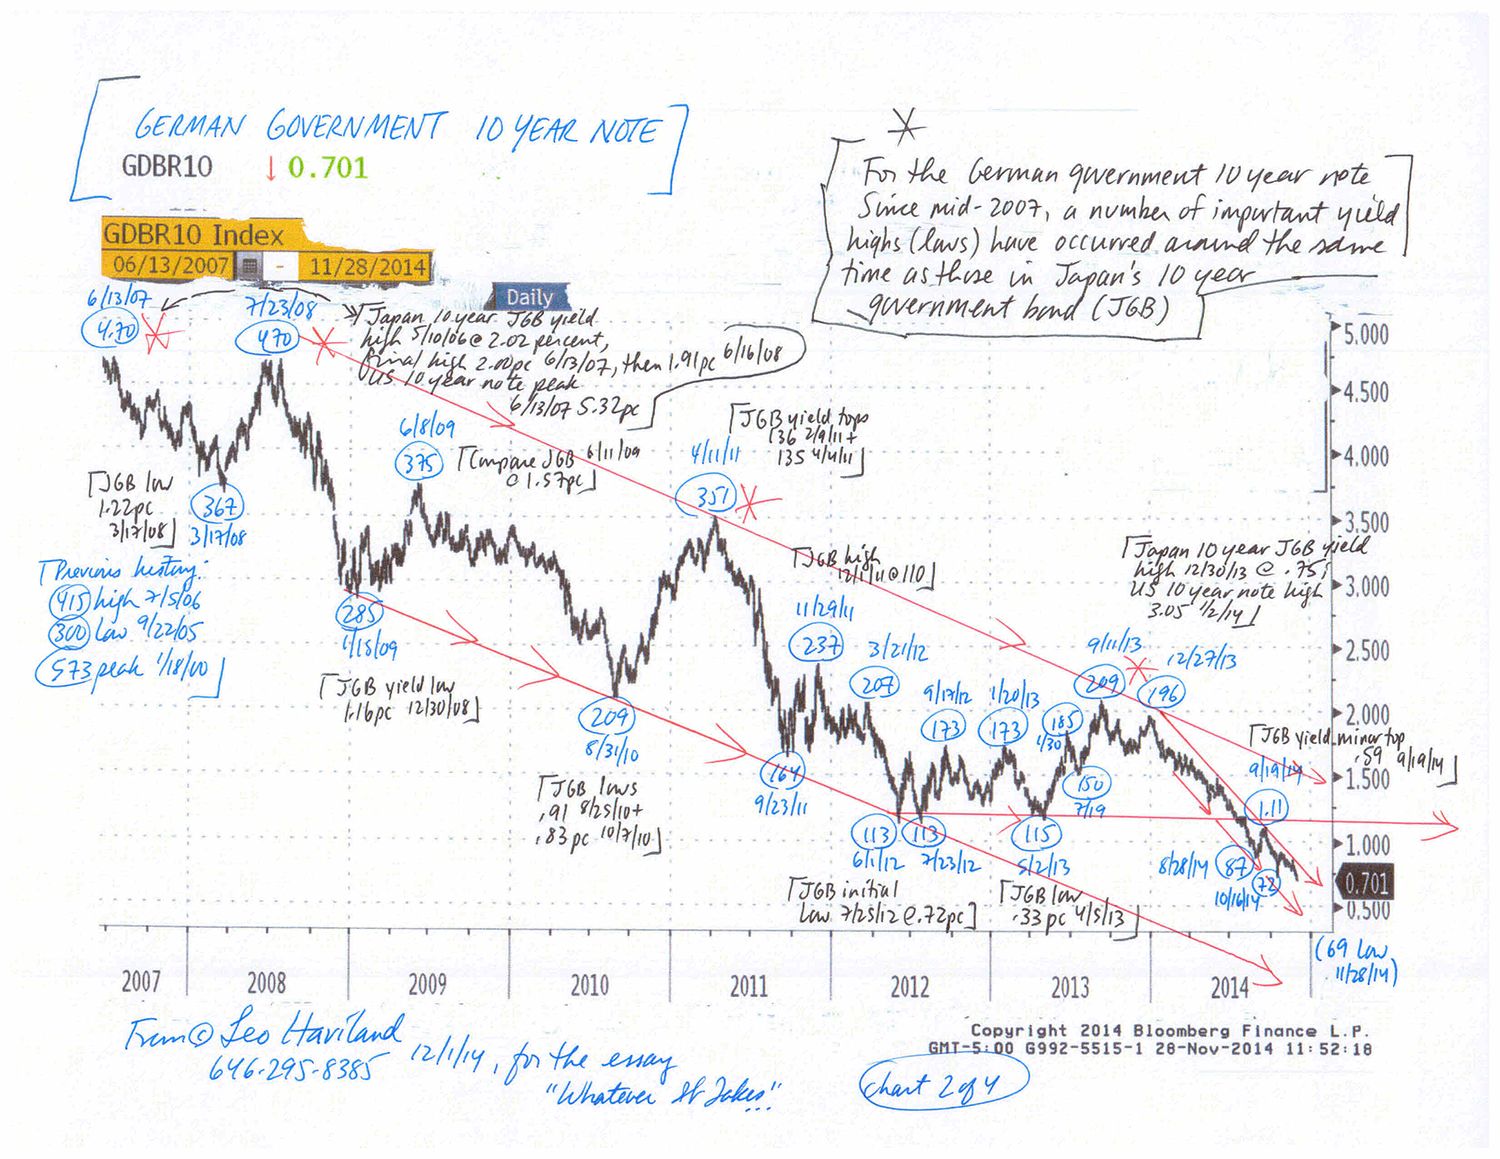
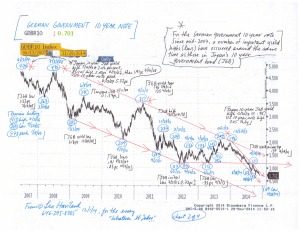
One sign of the obstacles facing the Eurozone and Japan in their quest to boost inflation (and generate higher interest rates) is the recent behavior of the UST 10 year government note. American GDP recently has been robust, rising at an annual rate of 4.6 percent in 2Q14 and 3.9pc in 3Q14. However, the UST 10 year yield around 2.20pc remains well beneath its 1/2/14 top at 3.05pc. Admittedly the UST yield bounced up from the 1.86pc low of 10/15/14. But even since that mid-October 2014 depth, yields traveled up to only around 2.40pc, never piercing the important resistance around that level. The failure of UST yields to rally may signal future mediocre US (and worldwide) economic growth since yields generally advance during recovery (or hope of one).
Take the broad Goldman Sachs Commodity Index (GSCI) as a benchmark for commodities “in general”. It collapsed, of course aided by price dives in the petroleum complex, from 6/23/14’s interim high around 673 to under 520 recently. If sustained, this bloody price retreat will cut many statistical measures of inflation (and perhaps reduce inflation expectations). Thus it may encourage European and Japanese (and other) policy makers to embark on especially accommodative monetary policies. For example, the ECB may decide it has more need (justification) to quickly engage in massive QE, perhaps even by sovereign debt buying.
However, this GSCI weakness also may indicate underlying and ongoing risks to global economic growth as well as the difficulty of generating sufficient inflation in general. Moreover, sustained declines in petroleum prices may create crises in some producing nations that in turn spill over into other nations. For example, think of Russia (the ruble has moved over 50 versus the dollar), Nigeria, and Venezuela.

FOLLOW THE LINK BELOW to download this article as a PDF file.
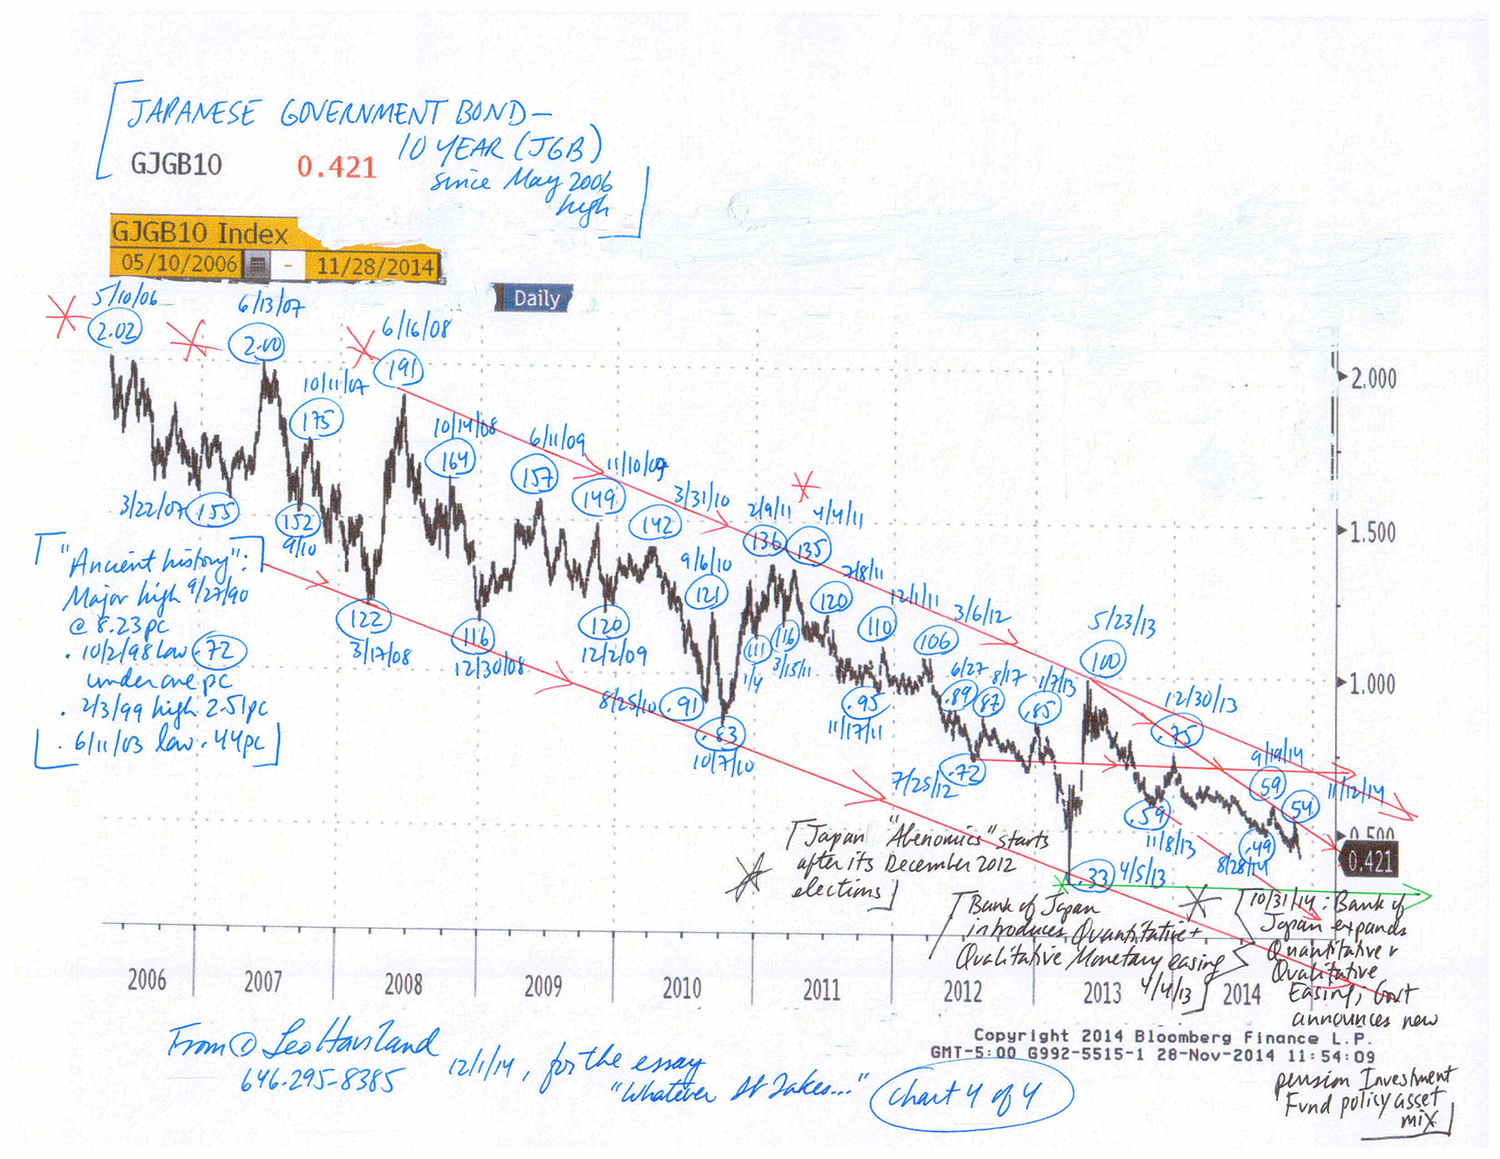
Whatever It Takes- Recent Eurozone and Japanese Adventures (12-1-14)
Charts- FX and 10 Yr Govt Note of Eurozone and Japan (12-1-14, for essay Whatever It Takes)
Currency marketplace watchers generally concentrate their attention on important cross rate relationships such as the US dollar against the Euro FX, Canadian dollar, Japanese Yen, or Chinese renminbi. However, broad real currency indices (trade-weighted or effective exchange rate) offer greater insight regarding the actual overall strength (or weakness) of any given currency than does a particular cross rate. Thus the broad real trade-weighted dollar is a more comprehensive benchmark for “the dollar in general” and its relationship with debt, stock, commodity, and other arenas.
As the Goldilocks Era faded and the dreadful worldwide economic disaster of 2007-09 unfolded, not only did US Treasury yields collapse alongside massive falls in the S+P 500, emerging marketplace equities, and commodities. During the darkest times of that global financial crisis, the broad real US dollar, Japanese Yen, and Chinese renminbi all appreciated sharply.
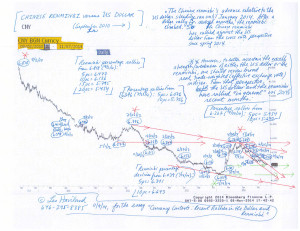
Though the renminbi has advanced relative to the dollar since around late April 2014, the broad real (effective exchange rate) yardsticks for both the renminbi and the dollar have rallied together (moved upwards) in recent months (since around mid-2014). In contrast to these bull moves in broad real exchange rates for the renminbi and the dollar, Japan’s real effective exchange rate weakened further in recent months. Moreover, despite the Yen’s depreciation, this simultaneous recent strength in both the dollar and the renminbi overlaps with (confirms) declines in UST 10 year yields and slumps in emerging marketplace stocks and commodities. In this context, in a world of interrelated marketplace battlefields, and given the increasing importance of China in the international economy, the hand-in-hand (joint) rally in the broad real dollar and renminbi indices also warns that a notable top in the S+P 500 may soon emerge.
The recent declines in the Yen and the Euro FX probably hint that the worldwide economy is weakening, not strengthening. Note too the indications of a slowdown in China’s enviable GDP growth rate. In this context, dramatic falls in currencies such as the Russian ruble also can signal or spark potentially more widespread weakness.
The upward trends in the broad real trade-weighted dollar and the renminbi real effective exchange rates probably will continue. For the near term, the Yen’s effective exchange rate probably will remain relatively weak. However, if the world economic situation worsens significantly relative to the current scene, since the Yen appreciated very sharply during the 2007-2009 crisis, the Yen may depart from its current bearish path and venture somewhat higher.
FOLLOW THE LINK BELOW to download this article as a PDF file.
Currency Contexts- Recent Rallies in the Dollar and Renminbi (11-9-14)
Chart- Chinese Renminbi (11-9-14, for essay Currency Contexts)
In recent months, economic and political excitement within assorted emerging, developing, and frontier nations have entranced most marketplace observers and captured the attention of numerous politicians in the United States and other so-called advanced nations. In contrast, Japan, having once been in the limelight, nowadays stands in the background of the international financial theater. However, Japan currently deserves more of a starring role.
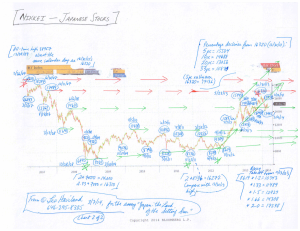
Japan’s changing political leadership in late 2012 and the subsequent major new round of substantial monetary laxness encouraged major- and intertwined- Japanese Yen weakness and Japanese equity (Nikkei) strength. The new Japanese policies, the Nikkei’s stratospheric rally, and the Yen’s rapid bear tumble probably helped to encourage global economic optimism in general as well as rallies in the S+P 500 and many other key world stock marketplaces in particular.
Yet at present, many players nevertheless increasingly take for granted Japan’s extraordinary monetary easing actions of early 2013 (and related other parts of “Abenomics”) and their marketplace consequences. Clairvoyants likewise currently place comparatively little emphasis on Japan’s current sluggish GDP prospects. They also do not underline that both the Japanese Yen and Nikkei apparently entered into a sideways trend beginning around late May 2013.
Of course diverse and entangled variables influence economic levels and trends (and storytelling about them), whether in Japan or elsewhere. But because Japan rather recently ventured on such extraordinary monetary easing, signs of mediocre Japanese economic performance warn that other very lax central bank policies increasingly will have diminished growth benefits as time passes. For example, the International Monetary Fund predicts Japan’s calendar 2015 real GDP will increase merely one percent. Japan also has not escaped its gloomy government spending and debt situation. The sideways trends in the Nikkei and Yen arguably reflect such current (potential) Japanese performance.
The recent high in Japanese stocks and bottom in the Yen probably will not be broken by much if at all any time soon. Also, a notable (even if not major) decline in the Nikkei from its recent peak alongside a rally in the Yen relative to its recent low will be a bearish sign for the world economy as well as for the S+P 500 and many other stock marketplaces.

FOLLOW THE LINK BELOW to download this market essay as a PDF file.
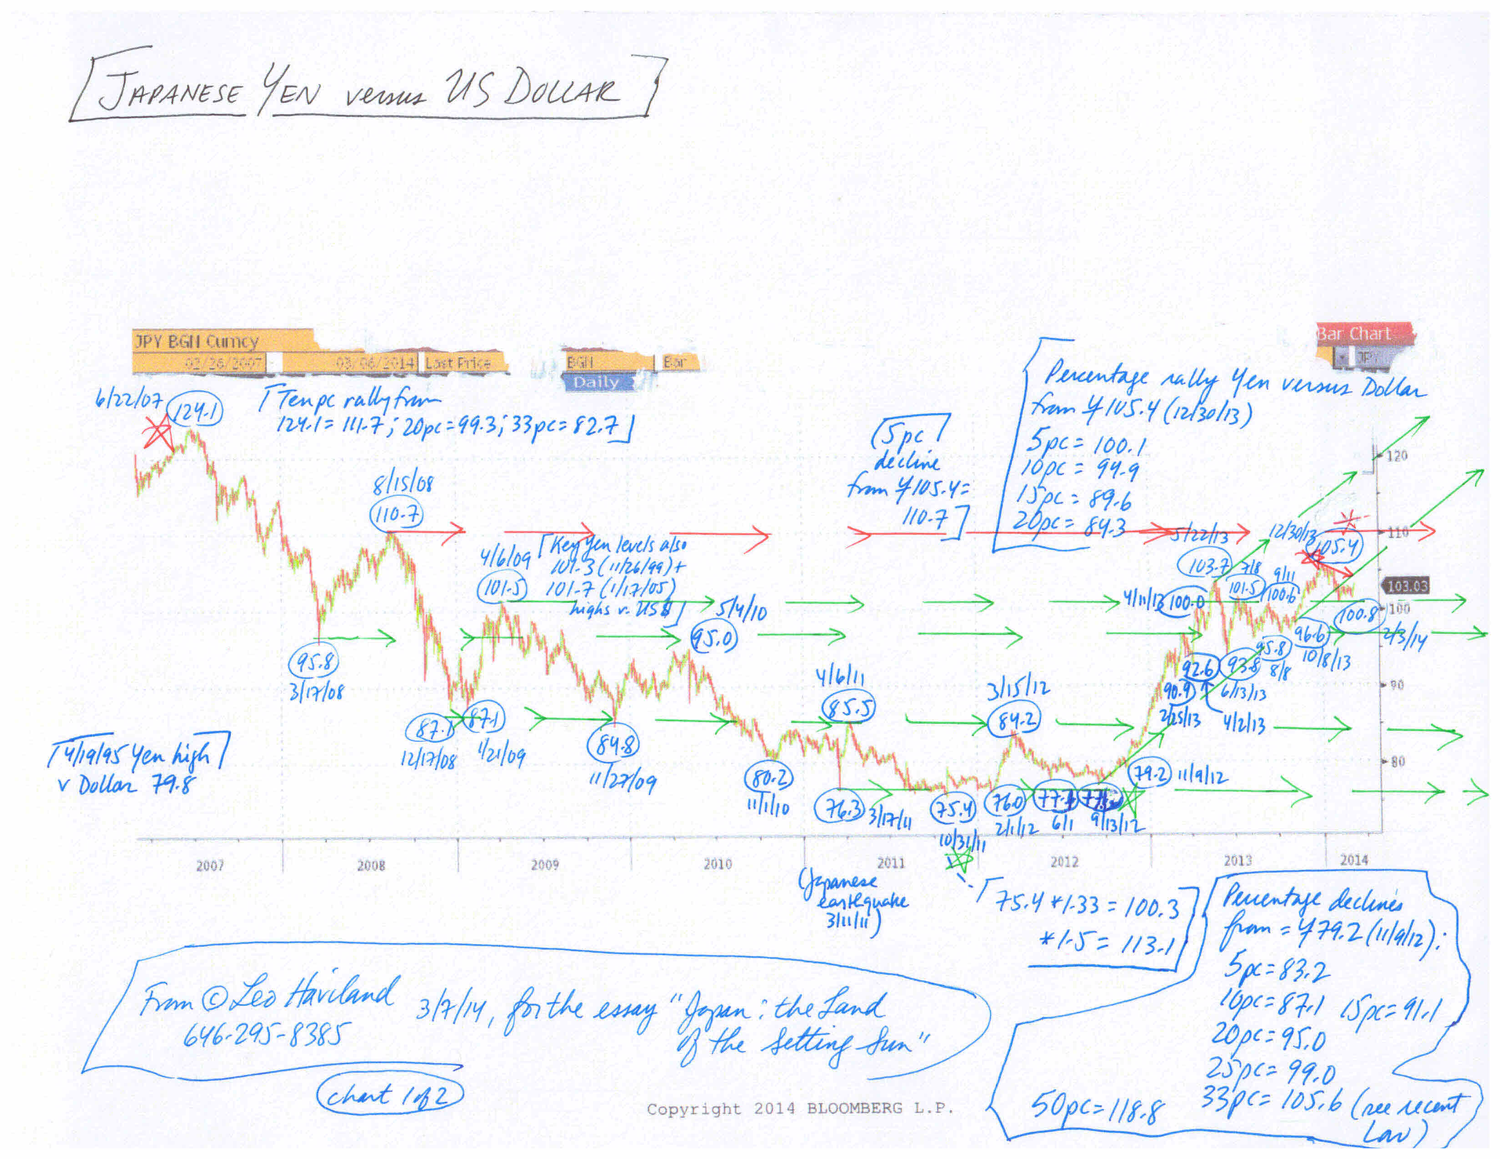
Japan- the Land of the Setting Sun (3-7-14)
Charts- Japanese Yen and Nikkei (3-7-14)
The broad real trade-weighted United States dollar (TWD) not only will remain relatively weak, but also it probably will test its July 2011 bottom around 80.5 in the relatively near future.
Within and between currency, interest rate, stock, and commodity domains, observers debate marketplace intertwining, convergence/divergence, and lead/lag relationships and issues. In any event, since the economic crisis walked onto the world stage in mid-2007, and especially after its acceleration during 2008, many marketplace gurus ardently have promoted the guideline that a “weak US dollar equals strong US (and many other) stock marketplaces, strong dollar equals weak US stocks”. This beloved relationship probably no longer holds. In the current theater, the weak US dollar (and any further deterioration in it) now probably translates into falling American stock marketplace prices (use the S+P 500 as a benchmark). In addition, a still-relatively weak TWD (one not sustaining a venture much above its June 2012 peak at 86.3) will not bolster equities much if at all.
In recent months, and especially in the past several weeks, US dollar cross rates have displayed competing perspectives regarding dollar strength. Thus the dollar sometimes appears to be walking a tightrope. The US dollar has rallied recently against the currencies of many developing (and some rather developed) nations and assorted emerging marketplace nations. Several of these domains represent key commodity producers. However, the US dollar has eroded in recent weeks against the currencies of several of its major trading partners such as the Japanese Yen and Euro FX. The dollar remains relatively feeble against the Chinese renminbi as well. This weakness in these key crosses underlines not only the current weakness in the TWD, but also warns that the TWD is quite vulnerable to renewed declines. Moreover, falls of the US dollar in these key crosses (as does the weakness in the TWD in general) indicate that further declines in the US stock marketplace loom ahead (despite the Federal Reserve’s longstanding accommodative policies.
This viewpoint on intertwined US dollar and US equity weakness fits the stories of the dive in emerging marketplace equities (which began in 4/27/11; the “MSCI emerging stock markets index”/MXEF at 1212) and the fall in commodity prices (broad Goldman Sachs Commodity Index’s major downtrend commenced in spring 2011 with the 4/11 and 5/2/11 highs at 762), as well as the bear trend in US government notes. Yields for the 10 year UST bottomed 7/25/12 around 1.38pc; they established other important floors at 1.55pc (11/16/12) and 1.61pc (5/1/13). Note the fall in the MXEF from its 5/9/13 high around 1065 alongside the rise in US rates (especially from the 5/1/13 depth) in the context of the slump in many emerging/developing/commodity producing marketplace cross rates versus the dollar. Keep in mind the timing links (similar directional moves) in recent years between the MXEF and the S+P 500 (even though the S+P 500 climbed to new highs after spring 2011). The renewed faltering in emerging stock marketplaces in recent weeks warns of a notable fall in the S+P 500.
The S+P 500’s high on 5/22/13 near 1687 probably represents (or is very close to) a very significant high.
FOLLOW THE LINK BELOW to download this market essay as a PDF file.
Seeking Directions- US Dollar Retreats, Advances, and Relationships (6-14-13)
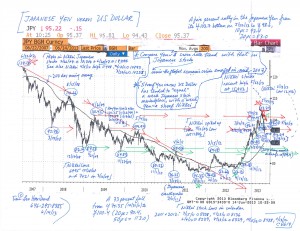
Japanese Yen versus US Dollar Chart (6-14-13)