GLOBAL ECONOMICS AND POLITICS

Leo Haviland provides clients with original, provocative, cutting-edge fundamental supply/demand and technical research on major financial marketplaces and trends. He also offers independent consulting and risk management advice.

Haviland’s expertise is macro. He focuses on the intertwining of equity, debt, currency, and commodity arenas, including the political players, regulatory approaches, social factors, and rhetoric that affect them. In a changing and dynamic global economy, Haviland’s mission remains constant – to give timely, value-added marketplace insights and foresights.

Leo Haviland has three decades of experience in the Wall Street trading environment. He has worked for Goldman Sachs, Sempra Energy Trading, and other institutions. In his research and sales career in stock, interest rate, foreign exchange, and commodity battlefields, he has dealt with numerous and diverse financial institutions and individuals. Haviland is a graduate of the University of Chicago (Phi Beta Kappa) and the Cornell Law School.


Subscribe to Leo Haviland’s BLOG to receive updates and new marketplace essays.

RSS View Leo Haviland's LinkedIn profile View Leo Haviland’s profile


TWO-STEPPING: US GOVERNMENT SECURITIES © Leo Haviland December 1, 2015

In the film noir “Double Indemnity” (Billy Wilder, director), Walter Neff describes the murder tale as “Kind of a crazy story with a crazy twist to it.”

****

OVERVIEW AND CONCLUSION

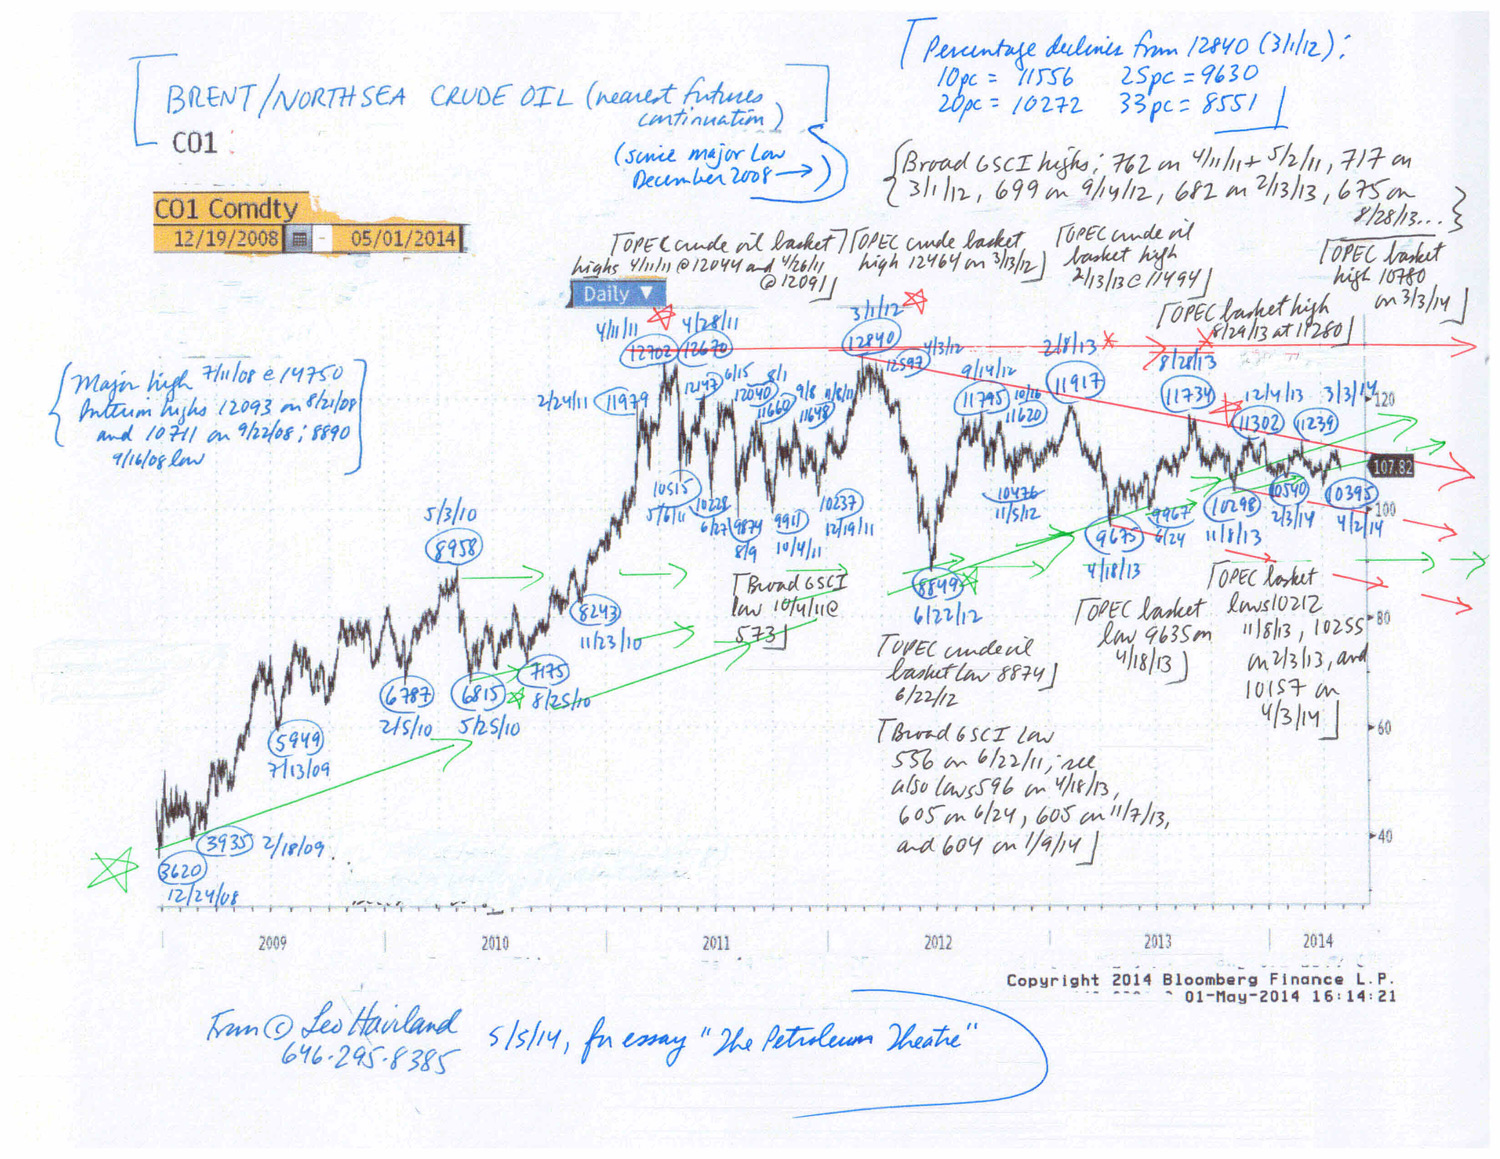
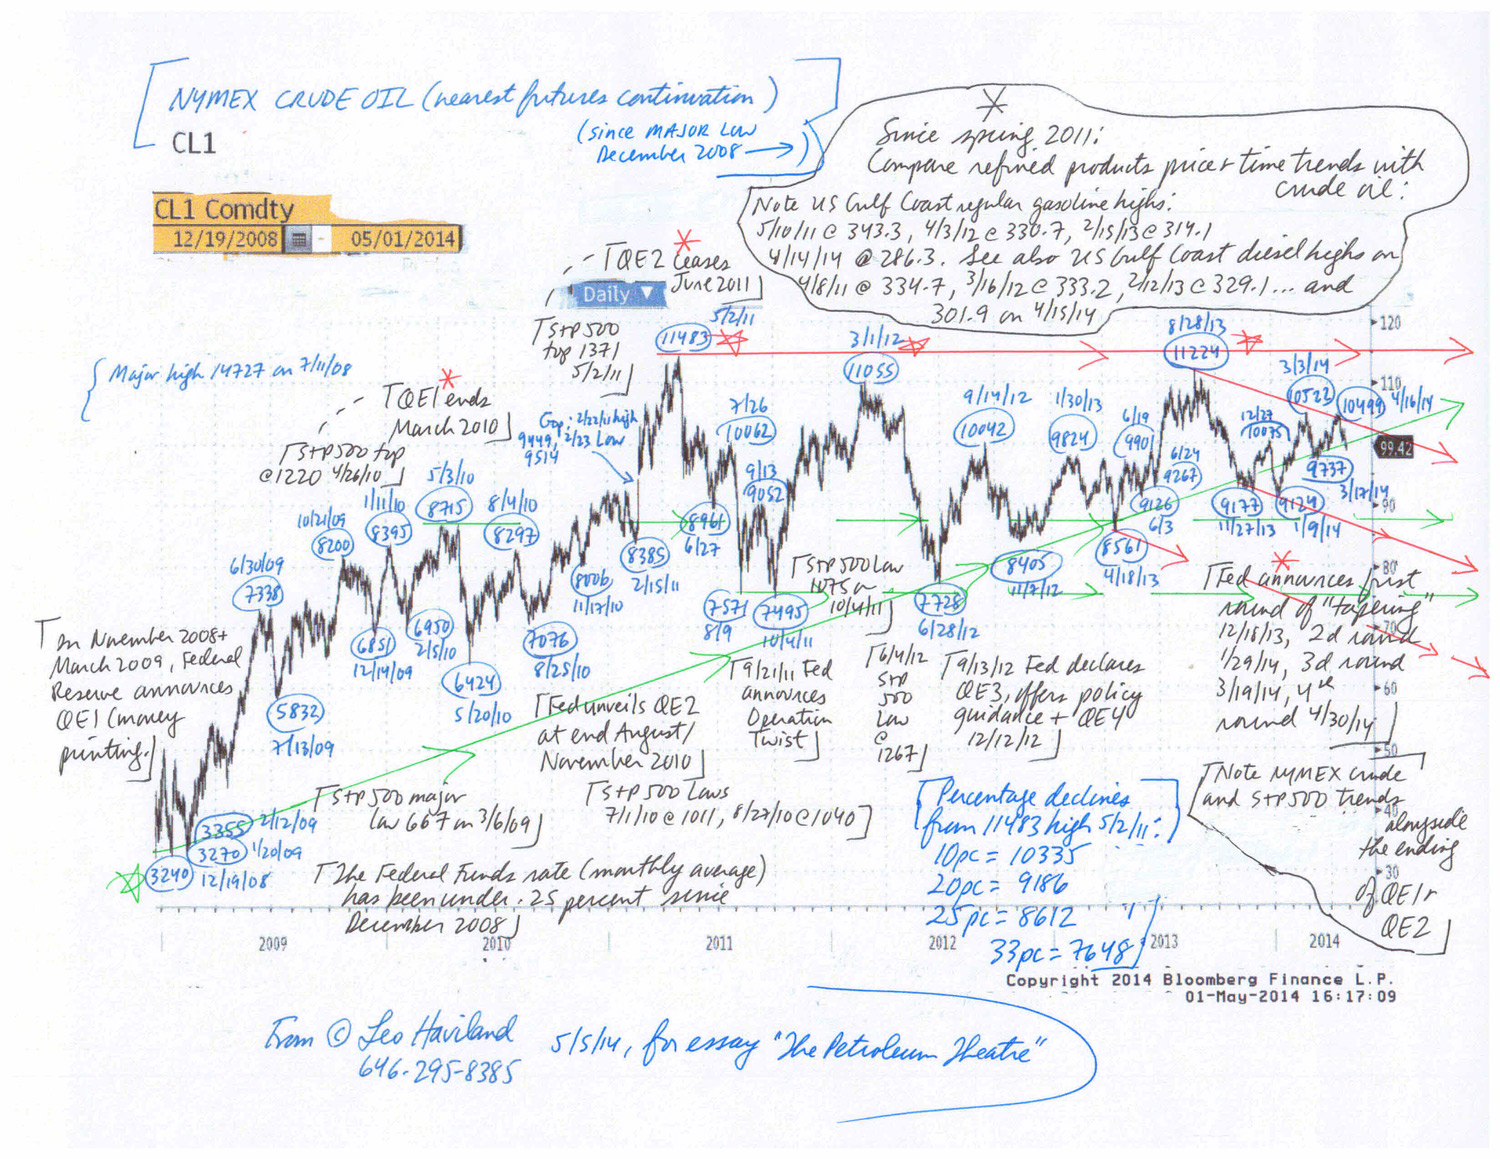
Over the last seven years, through the last stage of the bloody worldwide economic crisis and the ensuing often fitful recovery, through dramatic and sometimes violent swings in assorted financial playgrounds, America’s heroic Federal Reserve ferociously has pinned the Federal Funds rate to the ground.

Many marketplace clairvoyants believe this widely-beloved guardian relatively soon will cautiously begin prodding the Funds rate higher. The next Fed gatherings are 12/15-16/15, 1/26-27/16, and 3/15-16/16. Maybe the courageous Fed will lift the rate up 25 basis points in its December 2015 meeting! In any case, as the widely-watched United States government two year note resides near the Fed Funds rate from the yield curve perspective, the two year US Treasury level and trend in part reflect marketplace opinions regarding Fed policy shifts and inflation.

In any case, the recent elevations in the two year US Treasury note a few basis points over .90 percent probably will not be broken by much in the near future. There indeed are some signs that United States inflation has edged toward the Fed’s two percent target. The Fed also proclaims its desire to normalize its highly accommodative policy. Yet the Fed embraces a gradual approach and does not want to make any missteps. Also, the international economy (look at the Eurozone and China) has slowed. So the Fed probably will patiently assess the consequences of its rate move for the United States (and global) economy and marketplaces (such as the S+P 500 and the US dollar).

****

Yield levels and relationships obviously can fluctuate for all sorts of reasons. However, the falling rate trend for the US 10 year government note since early 2014 contrasts with the rising one for the UST two year note. The drop in 10 year UST yields, as it is occurring in the face of some US inflation and rising two year rates and artful Fed pillow talk about normalizing policy, arguably reflects economic weakness (mediocre GDP growth) in the US or elsewhere. In today’s interconnected world, feebleness elsewhere influences the American scene.

Note a related warning signal of actual or impending US economic weakness consistent with the fall in 10 year UST yields. Since the advent of money printing in the US in late 2008/early 2009, narrowing of the 10 year less two year spread roughly has coincided with the ending of that quantitative easing. This spread tightening (becoming less positive) in turn has reflected slower economic growth (or worries regarding potential weakness or recession). The agile Fed announced the actual first round of “tapering” (gradual ending of its latest QE venture) on 12/13/13, after several reductions in the QE program, tapering finished at end October 2014. The Treasury spread currently is close to its July 2012 depth.

Is a hunt for yield, fearful flight to quality, or need to own high-grade collateral more focused on the long end of the US government yield curve than the short end? Perhaps, but not necessarily. As the ECB extends its money printing program, is a shortage of long dated Eurozone government debt not only pushing yields there lower, but also thereby reducing yields for the UST long term instruments such as the 10 year? Perhaps. But economic weakness remains the most convincing reason for the sustained decline in UST 10 year yields since early 2014.

Consistent with the fall in the US 10 year yield and the narrowing of the 10 year versus two year yield spread, additional flags indicating weakness for the worldwide economy beckon. Although the S+P 500 remains high, emerging marketplace stocks in general and commodities continue to join hands in long-running substantial bear trends. The durable bull trend in the broad real trade-weighted dollar generally has danced in tune with the bear ones in emerging marketplace stocks and commodities.

FOLLOW THE LINK BELOW to download this article as a PDF file.
Two-Stepping- US Government Securities (12-1-15)

COMMODITIES: CAPTIVATING AUDIENCES © Leo Haviland October 12, 2015

OVERVIEW AND CONCLUSION

The Federal Reserve Board is a widely-watched star economic performer. Elvis Presley sings in “Jailhouse Rock” that “Everybody in the whole cell block Was dancin’ to the Jailhouse Rock”. The Fed’s actual and anticipated soulful lyrics and mesmerizing policy moves likewise attract, enthrall, and inspire Wall Street, Main Street, and political audiences. The Federal Reserve Board congregates 10/27-28/15 and 12/15-16/15.

****

Though major stock, interest rate, and currency marketplaces typically grab the lion’s share of marketplace and media attention, recently commodities “in general” have marched to center stage alongside them. Central bankers, finance ministers, and other leading economic players pay close attention to the analysis and forecasts of the International Monetary Fund. October 2015’s featured cover page titles of the IMF’s “World Economic Outlook” (“Adjusting to Lower Commodity Prices”) and “Fiscal Monitor” (“The Commodities Roller Coaster”) evidences this increased fascination with commodities.

Individual commodities such as crude oil, copper, and corn, as well as commodity sectors such as the petroleum complex, of course have their own supply/demand and inventory pictures. Perspectives on these can and do differ between observers. Yet commodity price trends in general are hostage not only to their own supply/demand situation and general economic growth trends, but also to movements in equities, interest rates, and foreign exchange. Particularly over the past several months, stock and other financial playgrounds more closely have intertwined with noteworthy travels in crucial commodity theaters such as petroleum and base metals. Such increasingly strong ties developed in the past during similar sustained dramatic commodity price adventures.

The current significant link between commodities in general (use the broad Goldman Sachs Commodity Index as a benchmark; the “GSCI” is heavily petroleum-weighted) and other key arenas such as the S+P 500, emerging stock marketplaces in general (“MXEF”; MSCI emerging stock markets index, from Morgan Stanley), and the broad real trade-weighted United States dollar (“TWD”) probably will persist at least for the next several months. Stocks, the dollar, and the GSCI probably will all move in a sideways path for the near term. The Fed and its allies do not want the S+P 500 to collapse twenty percent or more (and maybe not even much more than ten percent) from its May 2015 summit. They also do not want the TWD to break out above its September 2015 high (that barrier slightly exceeds the crucial March 2009 major top).

However, the bear move in the S+P 500 that emerged in May 2015 eventually will resume. The US dollar, though its rally from its July 2011 major low has paused, will remain relatively strong. OECD petroleum industry inventories in days coverage terms are very high from the historical perspective. Despite some crude oil production cuts in the United States and elsewhere, overall oil industry inventories likely will remain quite elevated through calendar 2016. So even if in the near term the broad GSCI rallies further from its current level (which likely would occur alongside a further modest S+P 500 ascent and dollar slide from their current altitudes), it probably ultimately will challenge its late August 2015 low.

****

As the enrapturing Goldilocks Era ended, stocks peaked before commodities. The S+P 500’s major high was 10/11/07’s 1576, with that in emerging marketplaces (MXEF) alongside it on 11/1/07 at 1345. The broad GSCI made its major peak on 7/3/08 at 894 (the Bloomberg Commodity Index (“BCI”) top also was on 7/3/08, at 238.5). However, this was close in time to the S+P 500’s final peak at 1440 on 5/19/08 (and the MXEF’s final top at 1253 on 5/19/08), and not long after the TWD’s important April 2008 low near 84.2 (Fed H.10; monthly average). The GSCI’s 2/19/09 major low at 306 (BCI bottom 2/26/99 at 74.2) occurred near the S+P 500’s major bottom, 3/6/09 at 667, which occurred alongside the TWD’s March 2009 major top at 96.9. The MXEF’s major trough occurred 10/28/08 at 446, its final low 3/3/09 at 471.

During the worldwide economic recovery that set sail around 2009, neither commodities in general nor the MXEF surpassed their 2008 plateau.

The major high in commodities in general and the MXEF (spring 2011) and their important 2014 interim tops occurred before the S+P 500’s May 2015 height. This pattern differs from the 2007-08 one. In late spring 2015, the S+P 500 (as did China’s Shanghai Composite stock index) nevertheless joined (encouraged) the slump in the MXEF and commodities alongside an acceleration of US dollar strength. Thereafter, as in the speeding up of the global economic crisis after around mid-2008, the S+P 500, MXEF, and broad GSCI retreated together in conjunction with TWD appreciation. Also note the similar late August 2015 troughs in commodities and stocks. Though more recent data from the Fed on the TWD eventually will emerge, key US dollar cross rates in the past couple of weeks hint the broad TWD perhaps has slipped a bit since its September 2015 high.

****

Is OPEC’s new policy of reducing high-cost (non-OPEC) production succeeding? Some, but not a great deal so far. Despite the dive in drilling rig counts, OECD days coverage levels and the worldwide supply/demand balance for 2015 and 2016 reveal plentiful petroleum.

FOLLOW THE LINK BELOW to download this article as a PDF file.
Commodities- Captivating Audiences (10-12-15)

THE PETROLEUM THEATRE © Leo Haviland May 5, 2014

The worldwide petroleum marketplace “in general” will continue its sideways to down trend.

Despite modest global economic growth and forecasts by leaders such as the International Monetary Fund for further expansion, despite sustained highly accommodative monetary policy by the Federal Reserve Board and its allies, look at petroleum price benchmarks such as NYMEX and ICE Brent/Sea crude oil contracts (nearest futures continuation), as well as at US Gulf Coast regular gasoline and diesel. These gradually have retreated from their 2011/2012 peaks.

Note the similar weakness in emerging stock marketplaces “in general”, including China’s. Indeed, Chinese economic growth probably is significantly less than many believe. Given China’s major role in the world commodities arena, that portends further weakness in the overall commodities universe (see the S+P broad GSCI or other indices) and petroleum in particular.

Moreover, the Federal Reserve continues to taper its gargantuan bond buying (money printing) program. Ceasing money printing in 2010 and 2011 encouraged United States equity (use the S+P 500 as a benchmark) and commodity (and emerging stock) marketplace weakness. Though history may not repeat itself, the Fed’s ending of this round of quantitative easing probably will maintain the current sideways to down pattern in the petroleum complex. In recent years, the S+P 500 and commodities “in general” (including the overall petroleum complex) have tended to make noteworthy marketplace turns around the same time. Though the S+P 500 of course continued its bull move since spring 2011 while commodities in general moved in sideways to down fashion, this timing turning point relationship since spring 2011 has tended to persist.

Moreover, overall OECD petroleum industry inventories probably are slightly high, with total US days coverage several days above average. Supply/demand estimates for calendar 2014 indicates that global oil stocks will not decline much if at all this year.

1

2

FOLLOW THE LINK BELOW to download this article as a PDF file.
The Petroleum Theatre (5-5-14)
Charts- NYMEX and Brent crude oil

CHINESE RATES: OPENING THE GATES © Leo Haviland December 2, 2013

Although China’s economy of course differs from those of other major nations around the globe, it intertwines with them. However, China’s huge debt securities marketplace receives relatively little attention from traders, analysts, and the media in comparison to those of the United States, the Euro Area, and Japan.

Debt, stock, currency, and commodity marketplace observers concentrating on matters such as Federal Reserve Board policy and the S+P 500’s level and trend should extend their vision to include Chinese interest rates. China’s 10 year government note, after establishing bottoms at 3.24 percent on 7/12/12 and 3.41pc on 5/10/13, has raced higher. After a brief stop at 4.02pc on 10/8/13, the note decisively crashed through 2011’s 4.10pc barrier, recently breaking through 2007-08’s wall around 4.60pc to reach its recent high of 4.70pc on 11/21/13. The one year government note yield likewise has ascended significantly. Chinese government interest rates probably will continue to climb higher.

Near-universal optimism reigns regarding China’s economic situation and prospects. Even if the national economy is relatively robust, it may be less so than many believe.

Given China’s obvious importance to the world economy, a greater than expected slowdown in the marvelous Chinese growth rate, in part due to sustained higher yields, probably would entangle with and undermine recovery prospects in other territories. Moreover, since the end of the joyous Goldilocks Era and during the dreadful international economic crisis and the subsequent recovery, many turning points in the 10 year Chinese government note have occurred around the same time as those in benchmark 10 year US Treasury and German government notes. Thus despite the yield repression policy tightly embraced by the Federal Reserve and its central banking allies, the notable ascent in Chinese government interest rate yields underlines that the overall long run trend for yields in most key nations is probably higher.
12-2

FOLLOW THE LINK BELOW to download this market essay as a PDF file.
Chinese Rates- Opening the Gates (12-2-13)
Chart- Chinese Government 10 Year Note (for essay, Chinese Rates- Opening the Gates) (12-2-13)