GLOBAL ECONOMICS AND POLITICS

Leo Haviland provides clients with original, provocative, cutting-edge fundamental supply/demand and technical research on major financial marketplaces and trends. He also offers independent consulting and risk management advice.

Haviland’s expertise is macro. He focuses on the intertwining of equity, debt, currency, and commodity arenas, including the political players, regulatory approaches, social factors, and rhetoric that affect them. In a changing and dynamic global economy, Haviland’s mission remains constant – to give timely, value-added marketplace insights and foresights.

Leo Haviland has three decades of experience in the Wall Street trading environment. He has worked for Goldman Sachs, Sempra Energy Trading, and other institutions. In his research and sales career in stock, interest rate, foreign exchange, and commodity battlefields, he has dealt with numerous and diverse financial institutions and individuals. Haviland is a graduate of the University of Chicago (Phi Beta Kappa) and the Cornell Law School.


Subscribe to Leo Haviland’s BLOG to receive updates and new marketplace essays.

RSS View Leo Haviland's LinkedIn profile View Leo Haviland’s profile


US NATURAL GAS TRENDS: BOTTLED UP (c) Leo Haviland September 30, 2013

What is the outlook for United States natural gas prices (NYMEX nearest futures continuation)? Assume normal weather. From now through winter 2013-14, and probably for at least several months thereafter, the marketplace will be trapped in a sideways pattern.

From now through winter 2013-14, near term (on balance) bearish considerations and longer term (net) bullish ones intertwine to bottle up US natural gas prices. The American natural gas supply/demand situation from the production and consumption sides for the remainder of 2013 and calendar 2014 on balance is slightly bearish. Inventory days coverage becomes somewhat more bearish at end March 2014 relative to end October 2013. Natural gas demand from the key electric power sector arguably will not ascend much in the near term unless prices sustain dips under 350. Electricity demand for calendar 2014 grows very little year-on-year. To what extent will increasing supplies of energy from renewable sources put a lid on gas demand?

However, substantial US LNG exports represent a key bullish prospect for the relatively distant future. Coal plant retirements should underpin natural gas prices over the long run. The nation does not appear to be rushing to construct new nuclear power facilities. Although Mexico is currently a modest outlet for American gas exports, it is a growing one. Over the long run, what about demand for natural gas powered vehicles?

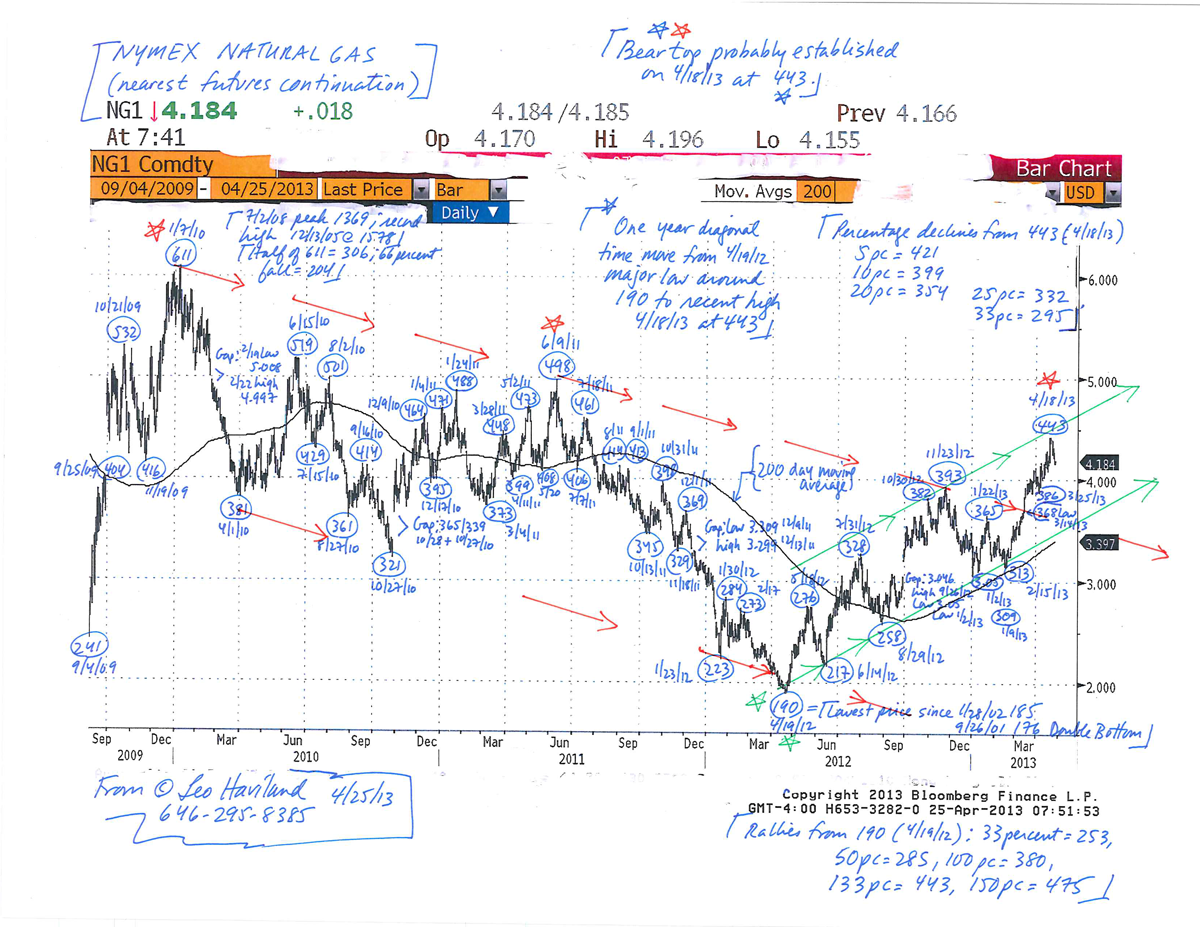
Recall spring 2013’s important highs just under 445 (4/18/13 at 443; 5/1/13 at 444) as well as the significant lows around 305 to 313 (305 on 1/2/13; 313 on 2/15/13 and 8/8/13). Between now and the close of winter 2013-14, the broad price range probably extends from roughly 280/310 to 440/460. Around 350 is a so-called equilibrium point within this price tunnel. It will take abnormal weather to provoke breaks of the extremes of this range during winter 2013-14, especially the high end (or beneath 280). Assuming this upcoming winter is neither unusually warm nor surprisingly cold, in general this price band probably will persist for at least a few months after winter departs. However, within the next several months, a test of the NYMEX nearest futures calendar 2013 lows around 305/313 is probable.

In any event, the long term price pattern for natural gas is sideways as well, though the top of the range probably extends to around 500/530 (or higher), with the amount of LNG exports, the extent of natural gas production increases at higher price levels (particularly at 400 and up), and the extent of US economic growth being crucial considerations.
Read the rest of this entry »

US NATURAL GAS: THE 2013 BUILD UP © Leo Haviland April 25, 2013

Assuming normal weather, the United States natural gas inventory situation probably will remain around average levels (1990-2012 history) in days coverage terms as the April/October 2013 build season marches forward. Yet if NYMEX prices (nearest futures continuation basis) persist over 400, there is a modest risk that over the next several months greater stock increases than many forecasters predict will occur. In any event, even based on current Energy Information Administration (EIA) supply/demand estimates, by the end of winter 2013-14 draw season, US natural gas days coverage probably will be moderately above average. Also, not only has the major bull move from the dismal April 2013 bottom around 190 (4/19/13) to recent highs around 443 (4/18/13) been enormous (about 133 percent); it has been lengthy in time (a one year diagonal time move).

So what is the near term outlook for US natural gas prices (nearest futures continuation)? They probably will retreat further from around the levels reached in mid-April 2013. A 20 percent decline gives around 354; important support exists around the 305/310 1Q13 lows. What about the mystical time horizon called the long run? Suppose weather is normal and the American economy grows moderately. The longer run natural gas trend probably will be sideways, with the broad range roughly 280/310 to 490/520.
Natural-Gas-Chart-(NYMEX-nearest-futures)-(4-25-13)

FOLLOW THE LINK BELOW to download this market essay as a PDF file.
Natural Gas Chart (NYMEX nearest futures) (4-25-13)
Natural Gas- the 2013 Build Up (4-25-13)

US NATURAL GAS: THE WINTER INVENTORY DRAWING BOARD © Leo Haviland October 1, 2012

Having established a major low at 190 on 4/19/12 (NYMEX nearest futures continuation), natural gas marched sharply higher, reaching significant resistance around 330 (7/31/12). After retreating to 258 (8/29/12), the marketplace renewed its assault on the 330 barrier in late September. Even if prices lose some ground in the near term, and assuming normal weather, a decisive advance above that level, and to at least major resistance hovering at 380 to 415, probably will occur in the next few months. It would not be surprising if the initial assault on 380/415 occurred relatively soon.

But why will prices keep climbing? Admittedly, bears have good arguments. For example, current United States natural gas inventories (9/21/12 stocks of 3576bcf) are up about nine percent year-on-year. Suppose weather is around average for the 2012-2013 winter draw season. An initial review of United States natural gas inventories from a days coverage perspective indicates oversupply for the upcoming draw season.

However, there arguably is less oversupply in the near term than many believe. There seems to have been an upward shift in desired stockholdings from the days coverage vantage point in recent years.

In addition, inventories during winter and at end season 2012-13 probably will be far less excessive than during the preceding draw season. This will tend to excite many bulls.

For the next few months, natural gas production growth appears to be flattening (compare calendar 2012 with 2013). But gas demand increases, assuming sustained higher prices over 330, and maybe a bit cheaper, also may level off.

Yet it seems that natural gas is “looking forward” over a longer horizon than just the next few months (or maybe even calendar 2013). A bullish aura underpinning natural gas “for the long run” derives significantly from the coal plant retirement story (especially in 2014 and thereafter). This enthusiasm (though it may eventually confront supply jumps) thus thereby assists to some extent the bullish near term price trends. Also, nuclear power supplies probably will not increase much anytime soon; some players question how much and how quickly renewable supply will blossom from here.

This longer run bullish natural gas faith (orientation) has an implication for the probable willingness of natural gas producers to short hedge, say at around 380/415, or even 450 and beyond (strategies surely differ for each calendar year). Short hedging at these levels probably will be less than many believe.

What about LNG? The extent of LNG exports is conjectural. However, at quite low prices (picture under 200, maybe even 250), the export appeal rises. Though these floors are much beneath current prices, this story tends to support the upward price bias established in April 2012.

Add a technical bull point from the timing perspective. Many key natural gas (NYMEX nearest futures) marketplace bottoms have been reached in late August and calendar September. This did not occur in calendar 2012, which argues that the new highs being made recently will be surpassed. Also, the minor low around 258 in late August, although not close to the April 2012 depth, nevertheless occurred at a time from which prices often have sprung higher. Thus the quick travel higher of the past several weeks argues for a further upward flight.

FOLLOW THE LINK BELOW to download this market essay as a PDF file.
Natural Gas- the Winter Inventory Drawing Board (10-1-12)

US NATURAL GAS- THERE HAS BEEN AND WILL BE BLOOD © Leo Haviland, January 31, 2012

What is the outlook for NYMEX natural gas prices (nearest futures continuation)? Even though current natural gas oversupply is substantial and will remain so for at least a few more months, the long run bear trend probably ended with the 1/23/12 low around 223. Admittedly, warmer than normal weather for the balance of this winter may inspire an attack on or even a slight breach of the January bottom. However, production cutbacks and higher demand gradually will erode much of the mountainous oversupply and help to ignite a rally.

Suppose announced production cuts motivated by prices crashing under 275 or so do not substantially materialize. Then first quarter 2012 lows may be challenged in late August/calendar September 2012. Regulatory issues, fuel switching, economic growth, anticipated drilling rates, weather issues, oil price levels, long run gas export potential, and alternative “investment” in commodities complicate predictions and boost the likelihood of violent price swings.

Prices should oscillate within a broad range for quite some time. With support at 200/225, where is resistance? Look at 320/335, then 360/370 and 405/415. Above that loom 460 and 500/520. A band from around 200/225 to 500/520 admittedly seems very wide. Yet although 2012 is not 2009/10, recall that prices blasted much higher in a bull campaign lasting only four months, from 9/4/09’s 241 to 1/7/10’s 611. A foray up to the middle section of the broad range, 360 to 415, over the next several months is likely.

FOLLOW THE LINK BELOW to download this market essay as a PDF file.

Natural Gas- There Has Been and Will Be Blood (1-31-12)