

GLOBAL ECONOMICS AND POLITICS

Leo Haviland provides clients with original, provocative, cutting-edge fundamental supply/demand and technical research on major financial marketplaces and trends. He also offers independent consulting and risk management advice.

Haviland’s expertise is macro. He focuses on the intertwining of equity, debt, currency, and commodity arenas, including the political players, regulatory approaches, social factors, and rhetoric that affect them. In a changing and dynamic global economy, Haviland’s mission remains constant – to give timely, value-added marketplace insights and foresights.

Leo Haviland has three decades of experience in the Wall Street trading environment. He has worked for Goldman Sachs, Sempra Energy Trading, and other institutions. In his research and sales career in stock, interest rate, foreign exchange, and commodity battlefields, he has dealt with numerous and diverse financial institutions and individuals. Haviland is a graduate of the University of Chicago (Phi Beta Kappa) and the Cornell Law School.


Subscribe to Leo Haviland’s BLOG to receive updates and new marketplace essays.

RSS View Leo Haviland's LinkedIn profile View Leo Haviland’s profile



TAKING SHAPE: NYMEX NATURAL GAS BEAR TREND HISTORY © Leo Haviland January 19, 2015

What does historical analysis of noteworthy United States natural gas bear marketplace moves (NYMEX nearest futures continuation basis) reveal regarding the ending of the major bear trend that emerged in late February 2014? The mid-January 2015 low around 2.80 (NYMEX nearest futures continuation basis) could be, but probably is not, the final bottom. It is more likely that a final low will occur by end February 2015. The mid-January low probably will not be broken by much; in any event, substantial support lurks around 2.40.

Even if an observer focuses their attention on the natural gas price history variable alone, this is a very difficult marketplace call. In the current environment, much depends on weather, petroleum marketplace levels and trends (OPEC policy), whether (and how long) anticipated natural gas production jumps occur at current (or lower) gas prices, and the degree and duration of American economic strength. So the final bottom for natural gas may be postponed beyond February 2015.

Although history need not repeat itself, major natural gas lows (and highs) have not occurred in calendar March. April chronicles of course include the exceptional April 2012 major bottom; consequently, that calendar month represents a notable anniversary to watch, especially if weather for the balance of winter is warmer than normal. Gigantic inventories spurred the ferocious bear charge down to 1.90 in April 2012. However, assuming normal weather, and even allowing for increases in gas output, the current and probable US natural gas inventory situation looks relatively neutral, particularly in the context of NYMEX gas prices well under 4.00.

NYMEX natural gas reached many important troughs in late calendar August and September. However, a final low in late summer 2015 would stretch out the February 2014 bear marketplace longer than historical averages.

FOLLOW THE LINK BELOW to download this article as a PDF file.
Taking Shape- NYMEX Natural Gas Bear Trend History (1-19-15)
THE PETROLEUM THEATRE © Leo Haviland May 5, 2014

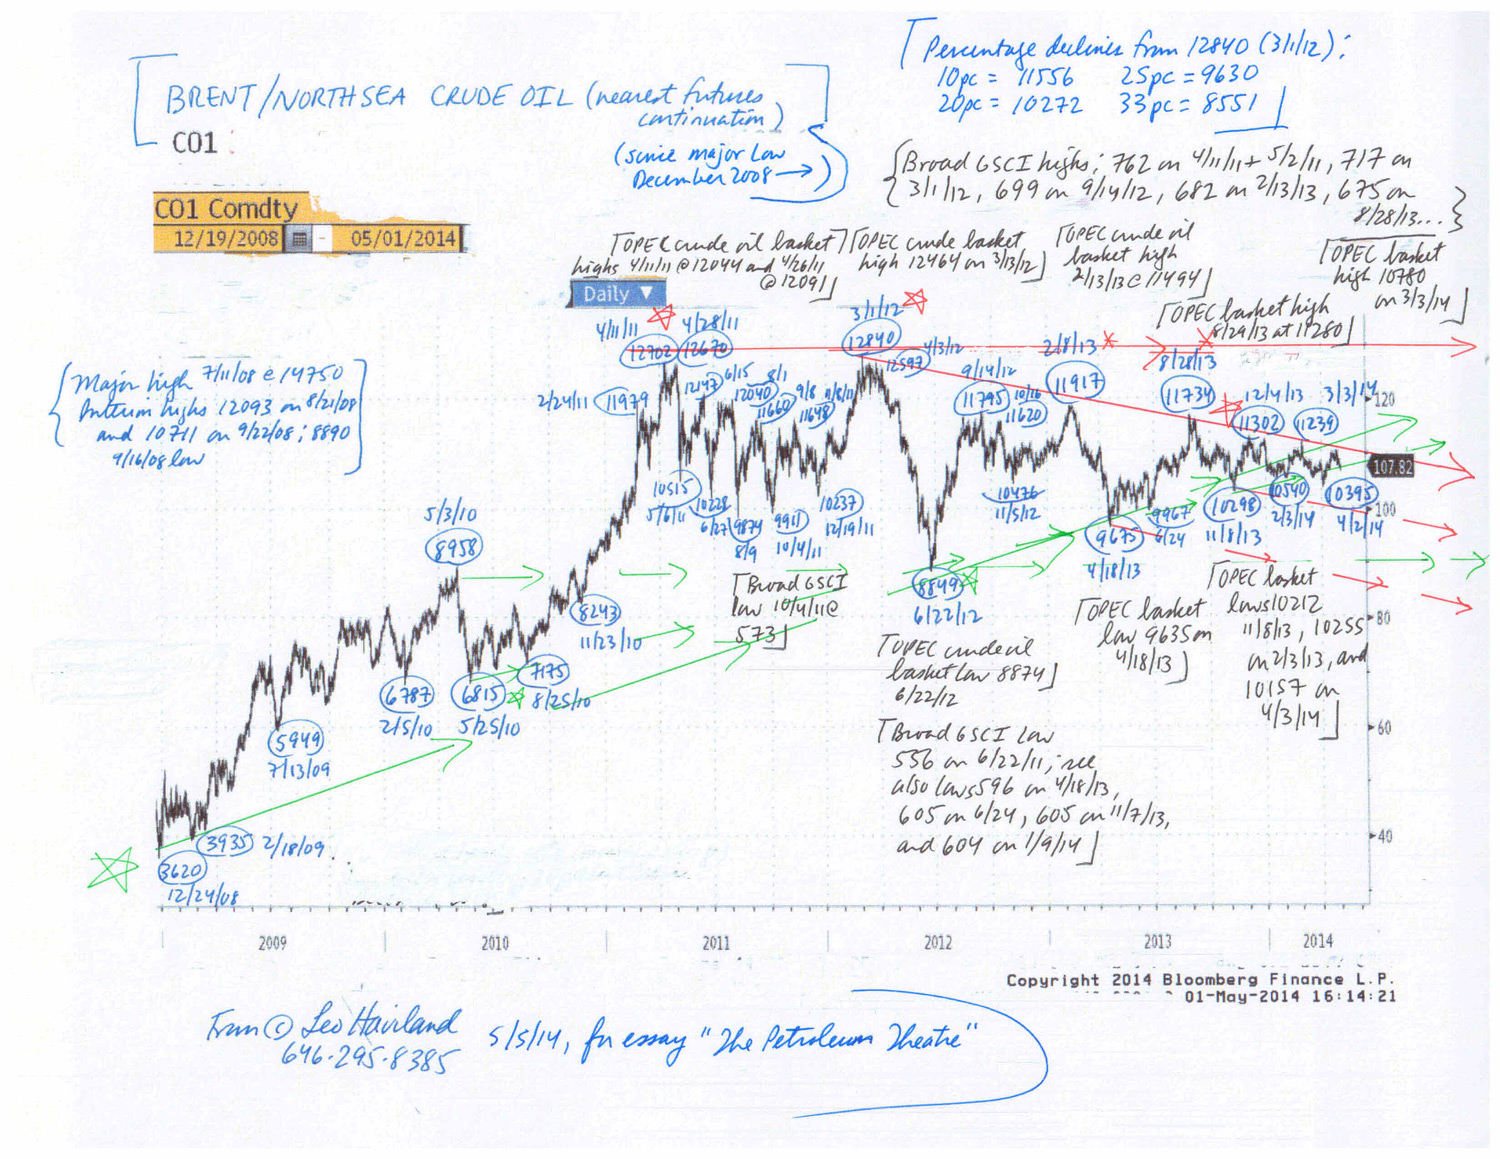
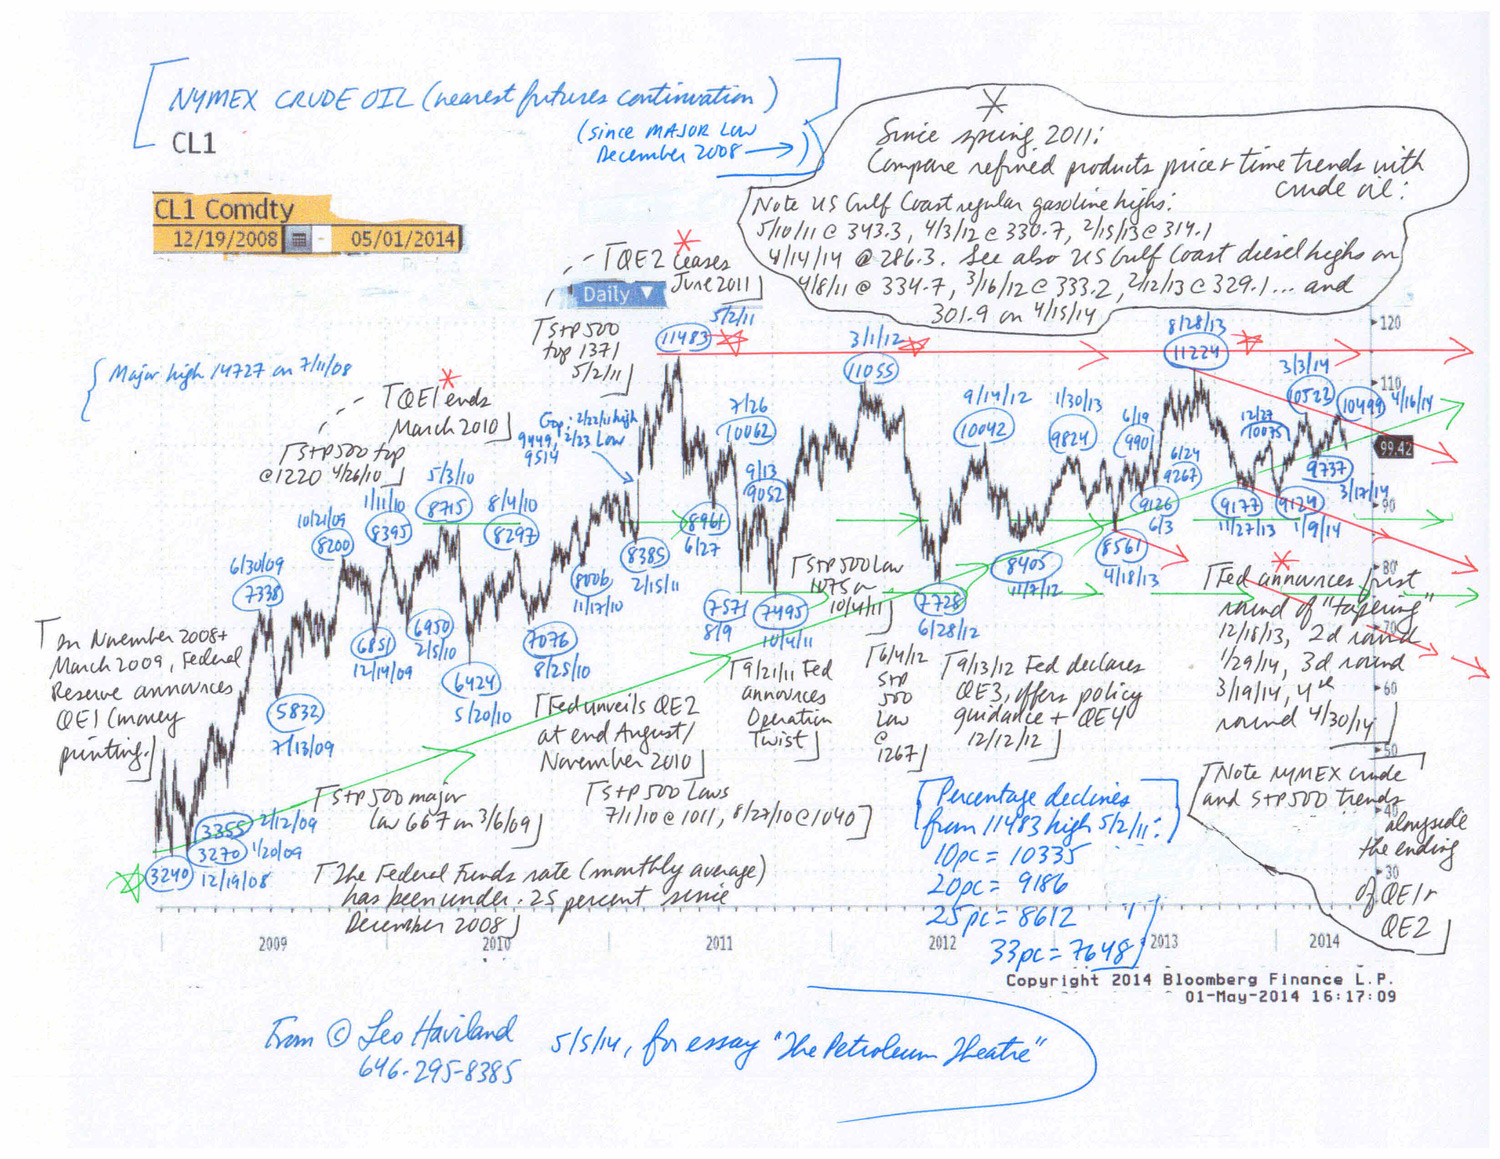
The worldwide petroleum marketplace “in general” will continue its sideways to down trend.

Despite modest global economic growth and forecasts by leaders such as the International Monetary Fund for further expansion, despite sustained highly accommodative monetary policy by the Federal Reserve Board and its allies, look at petroleum price benchmarks such as NYMEX and ICE Brent/Sea crude oil contracts (nearest futures continuation), as well as at US Gulf Coast regular gasoline and diesel. These gradually have retreated from their 2011/2012 peaks.

Note the similar weakness in emerging stock marketplaces “in general”, including China’s. Indeed, Chinese economic growth probably is significantly less than many believe. Given China’s major role in the world commodities arena, that portends further weakness in the overall commodities universe (see the S+P broad GSCI or other indices) and petroleum in particular.

Moreover, the Federal Reserve continues to taper its gargantuan bond buying (money printing) program. Ceasing money printing in 2010 and 2011 encouraged United States equity (use the S+P 500 as a benchmark) and commodity (and emerging stock) marketplace weakness. Though history may not repeat itself, the Fed’s ending of this round of quantitative easing probably will maintain the current sideways to down pattern in the petroleum complex. In recent years, the S+P 500 and commodities “in general” (including the overall petroleum complex) have tended to make noteworthy marketplace turns around the same time. Though the S+P 500 of course continued its bull move since spring 2011 while commodities in general moved in sideways to down fashion, this timing turning point relationship since spring 2011 has tended to persist.

Moreover, overall OECD petroleum industry inventories probably are slightly high, with total US days coverage several days above average. Supply/demand estimates for calendar 2014 indicates that global oil stocks will not decline much if at all this year.

1

2

FOLLOW THE LINK BELOW to download this article as a PDF file.
The Petroleum Theatre (5-5-14)
Charts- NYMEX and Brent crude oil

NORTH SEA CRUDE OIL OUTPUT: PERSPECTIVES AND PRICE CONSEQUENCES © Leo Haviland, January 3, 2013

For over a decade, and notably since the mid-2000s, OECD Europe crude oil production has slumped as a percentage of worldwide petroleum output. The majority of that European output issues from the North Sea. More importantly, yearly average European crude oil production has

plummeted over that span. North Sea production includes a key international crude oil price benchmark, Brent and related other offshore crude streams.

North Sea/Brent does not merely capture trader attention and spark media headlines. Despite its diminishing physical supply role as a share of global production, despite its sharp absolute production drop, North Sea/Brent’s marketplace power nevertheless is very important and extends around the globe. Why? The petroleum industry continues to price many other crude oils directly or indirectly relative to it. North Sea/Brent has a greatly disproportionate influence on global crude oil pricing relative to its output.

Moreover, not only has the barrel per day output of North Sea/Brent declined in recent years. Demand for the “high quality sweet” grades it represents remains substantial.

Consequently, all else equal, North Sea/Brent (“Brent”) crude oil supply in recent years generally has become tight (low “free supply”). So all else equal, since Brent acts as a price guide for other crudes, its supply/demand situation thereby tends to boost global crude oil prices to and sustain them at “high” (or “relatively high”) levels.

Brent’s bottom at the depth of the worldwide economic crisis was $36.20 per barrel (12/24/08). Although it peaked 3/1/12 at 12840 (making a double top alongside the 4/11/11 and 4/28/11 plateaus around 12700), at over 11000 it still remains quite high.

In 2000, European crude oil production was about 6.8mmbd, nearly equal to 1996’s 6.7mmbd. By 2004, it eroded to 6.1mmbd. European oil output represented 9.2 percent of world supply in calendar 1996, 8.8pc in 2000, and 7.3pc in 2004.

Since 2004, European output continued its steady and sharp descent, as did its share of total world oil production. In 2005 it was 5.7mmbd (6.7pc of global supply), with 2006 at 5.3mm (6.2pc), 2007 five mmbd (5.8pc), and 2008 4.8mmbd (5.5pc).

In 2009, it was 4.5mmbd (5.3 percent). In 2010, it was only 4.1mmbd (4.7pc), with 2011’s down even further to 3.8mmbd (4.3 percent of 88.4mmbd). The IEA estimates 2012 at 3.4mmbd, down about 50 percent from the 1996/2000 heights and merely 3.7pc of global production about 90.8mmbd (assume 4Q12 supply stood around that of the prior three quarters).

Not only has Brent long been a major international benchmark crude oil. Arguably its guiding influence on petroleum pricing has grown in recent years.

Compare the secular decline in North Sea crude oil output with recent US crude oil production trends. America’s long-run crude oil production tumble ended around 2008. Read the rest of this entry »

US PETROLEUM- TAKING STOCK © Leo Haviland, May 8, 2012

Crude oil streams and various refined products create an array of petroleum supply/demand pictures. Although America of course is not the entire oil universe, a survey of the recent overall United States petroleum inventory scene offers insight into the general petroleum price trend. Also recall the linkage in recent years of major trends between the S+P 500 and the petroleum complex (and commodities “in general”). This analysis of petroleum inventories in context underlines the current bearish trends in petroleum and the S+P 500.

At end March, US oil industry total inventory averages 50.3 days coverage (1996-2011, crude and products combined relative to total product supplied per day for that calendar month, Energy Information Administration inventory data; Strategic Petroleum Reserve stocks not included). End March 2012 days coverage climbed to 58.9 days supply. Not only did this soar more than eight days above average. It established a new record for that calendar month for the 1996- present era. Although the United States economy has been in a recovery for almost three years, these inventories broke beyond March 2009’s 58.2 day summit, achieved in the depths of the worldwide economic crisis and the month of the S+P 500’a major low (3/6/09 at 667).

These high supplies for March 2012 are not a one month aberration. Glance at the previous three months in historical context. From 1996 through end 2011, average total inventory for December is 50.2 days, January 51.0 days, and February 50.0 days. December 2011 ascended to a new record high for that calendar month; its 56.3 days of supply decisively beat 1998’s 55.4 days. What about January 2012? Not only is its 58.9 days coverage about eight days above average. They smash January 2010’s top of 56.8 days (compare January 2009’s lofty 55.8 days). February 2012’s 57.9 days coverage likewise significantly exceeds its calendar month average. Its huge days coverage decisively climbs over the previous stockpile record of 56.9 days achieved in February 2009.

As of 4/27/12 (weekly EIA data), US petroleum industry inventory slipped to around 56.9 days of supply (average daily total product supplied for the most recent four weeks). Total oil industry stocks nevertheless remain ample from the days coverage perspective. Although not a new end April record elevation (2009 was 58.8 days), it still vaults more than five days over end April’s 51.5 days coverage average.

On balance, just-in-case fears regarding petroleum inventory probably are diminishing, and will continue to do so for a while longer. A bear trend in petroleum prices probably also will interrelate with attitudes regarding just-in-case inventory management. If prices are dropping, why worry quite so much about supplies, right? ****

Analysis of NYMEX noncommercial petroleum positions indicates they probably reached a peak recently. Liquidation by net noncommercial longs probably has helped to move oil prices lower and probably will continue to do so.

FOLLOW THE LINK BELOW to download this market essay as a PDF file.
Petroleum- Taking Stock (5-8-12)
NYMEX Crude Oil (5-8-12)