GLOBAL ECONOMICS AND POLITICS

Leo Haviland provides clients with original, provocative, cutting-edge fundamental supply/demand and technical research on major financial marketplaces and trends. He also offers independent consulting and risk management advice.

Haviland’s expertise is macro. He focuses on the intertwining of equity, debt, currency, and commodity arenas, including the political players, regulatory approaches, social factors, and rhetoric that affect them. In a changing and dynamic global economy, Haviland’s mission remains constant – to give timely, value-added marketplace insights and foresights.

Leo Haviland has three decades of experience in the Wall Street trading environment. He has worked for Goldman Sachs, Sempra Energy Trading, and other institutions. In his research and sales career in stock, interest rate, foreign exchange, and commodity battlefields, he has dealt with numerous and diverse financial institutions and individuals. Haviland is a graduate of the University of Chicago (Phi Beta Kappa) and the Cornell Law School.


Subscribe to Leo Haviland’s BLOG to receive updates and new marketplace essays.

RSS View Leo Haviland's LinkedIn profile View Leo Haviland’s profile


PLAYING IN THE BAND: OPEC AND OIL PRICES © Leo Haviland October 25, 2016

Not long after July 2008’s major peak in crude oil prices, the European Central Bank President, Jean-Claude Trichet, declared that “predictions of the future prices of commodities are probably the most difficult exercise you can imagine.” (“Introductory Remarks with Q&A”, 8/7/08)

****

CONCLUSION

OPEC, finally fearful of sustained low petroleum prices and renewed price slumps, troubled by elevated oil production and lofty inventories, formally met 9/28/16 in Algiers. The ministers established a crude oil production target range of 32.5 to 33.0 million barrels per day, beneath estimated September 2016 production of around 33.5mmbd. This agreement reflects a Saudi Arabian policy shift. That nation and its allies apparently will no longer countenance (risk) benchmark Brent/North Sea crude oil prices under around $35 to $40 per barrel for an extended period. OPEC ministers have engaged in dialogue with non-OPEC oil producers regarding output schemes. OPEC gathers 11/30/16 in Vienna. Output apparently will not be cut prior to the November meeting (Financial Times, 9/30/16, p20).

OPEC’s rhetoric and general policy approach likely will help support Brent/North Sea at prices around a $35-$40 range. However, for the near term, OPEC’s actions thus far in the context of the global supply/demand picture probably make it challenging for petroleum prices to sustain elevations more than a few dollars above their mid-October 2016 levels (on a nearest futures continuation basis, Brent/North Sea crude oil around $54, NYMEX around $52). Why? First, OPEC has not adopted specific country-based output reductions. Moreover, given ongoing quarrels within the organization, whether it will do so in November 2016 or even implement them in practice is uncertain.

In addition, actual OPEC crude production of 32.5/33.0mmbd probably will begin cutting oil stockpiles only by sometime around mid-2017.

Ongoing serious dialogue with crucial non-OPEC producers such as Russia represents a victory for OPEC. Suppose production cuts by notable non-OPEC nations combined with genuine OPEC discipline; that probably would help to rally prices above recent highs. The Saudi Arabian oil minister claimed that many nations will join OPEC in cutting production (Bloomberg, 10/19/16). However, he did not name names. If non-OPEC countries support OPEC measures, it is not nearly as clear as the Saudi minister claims that non-OPEC lands will slash output. A production freeze by Russia (and perhaps Mexico and other emerging marketplaces) is more likely, but even that is not certain. Russia’s President suggests his country is “ready to join the joint measures [freeze or production cut] to cap production” (Financial Times, 10/11/16, p20). Recall the 2/16/16 output freeze conversation between Saudi Arabia, Qatar, Venezuela, and Russia did not result in a production cut.

THE PETROLEUM RALLY: IS AN INTERMISSION APPROACHING?

Key resistance for NYMEX crude oil (nearest futures continuation) is the $51 to $52 band. The recent high was 10/19/16’s $51.93. This inched over 6/9/16’s $51.67 and represents nearly a 100 percent rally from February 2016’s $26.05 bottom. Brent/North Sea’s (nearest futures) high was 10/10/16 at $53.73 (6/9/16 top $52.86). Although petroleum and American natural gas do not always travel in similar fashion (“move together”), this crude oil timing parallels 10/13/16’s NYMEX natural gas top around 3.37. Although NYMEX crude oil prices have not fallen far from 10/19/16’s elevation, a five percent drop gives about $49.35, a ten pc one around $6.75.

Remember that OPEC, despite its enthusiastic September 2016 wordplay, and despite its making progress in dialogue with some non-OPEC members, does not have a well-defined (specific) production agreement (with specific quotas) yet. Its current crude oil output remains high.

A weaker US dollar arguably assists petroleum price rallies. But although the broad real US TWD (monthly average, Federal Reserve, H.10) is moderately weaker than its January 2016 pinnacle, the TWD remains strong. At 97.9 in September 2016, it stands above March 2009’s 96.8 major top (S+P 500 major low in March 2009).

The new record high in the S+P 500, 8/15/16’s 2194, surpasses 5/20/15’s noteworthy pinnacle at 2135, but not decisively (only by 2.8pc). The MXEF (emerging stock marketplaces) remains beneath its 4/27/15 top at 1069 (as well as previous highs in its downtrend: 1212 on 4/27/11 and 1104 on 9/4/14).

There are some signs of rising government interest rates, at least in the United States. The UST 10 year note is around 1.75 percent, up from 7/6/16’s 1.32pc. See “Running for Cover: Foreign Official Holdings of US Treasury Securities” (10/13/16). Although the Fed probably will not raise the Federal Funds rate in its 11/1-2/16 meeting (prior to the 11/8/16 US election), it may elect to do so in its 12/13-14/16 gathering.

Global economic growth remains relatively sluggish. Significant sovereign or corporate debt problems exist in many important countries.

****

Sometimes significant patterns and heights in net noncommercial petroleum positions can be in rhythm with important oil price trends. The current net noncommercial long position in petroleum is extremely substantial and probably is vulnerable to liquidation. A widespread run for the exits by such noncommercial longs likely would undermine petroleum prices.


FOLLOW THE LINK BELOW to download this article as a PDF file.
Playing in the Band- OPEC and Oil Prices (10-25-16)

OIL’S TROUBLED WATERS © Leo Haviland May 18, 2015

Where will petroleum prices voyage over the next several months? Although it is a difficult call benchmark NYMEX and Brent/North Sea crude oil prices probably are establishing a broad range. For NYMEX crude oil (nearest futures continuation), the range is roughly between $40-$45 and $65-$75 per barrel. On balance, crude oil prices probably will venture more to the middle to lower section of that range.

****

Petroleum’s supply/demand scene appears especially unsettled and uncertain. Navigating through that territory is challenging. However, “by itself (all else equal)”, the oil picture nowadays and for the near term looks bearish. Is OPEC’s new policy of reducing high-cost (non-OPEC) production succeeding? Not much so far. Despite the dive in drilling rig counts, OECD days coverage levels and the worldwide supply/demand balance for 2015 reveal plentiful petroleum.

Worldwide petroleum inventories generally are lofty and likely to remain so for the next several months. Though global oil consumption will edge up alongside rather modest economic growth, supply probably will exceed demand. Suppose benchmark Brent/North Sea prices (spot; or nearest futures continuation) sustain levels over $50 (and perhaps even $45) per barrel. Suppose non-OPEC production remains relatively high. Then OPEC, led by Saudi Arabia, probably will not alter its current output policy aimed at capturing market share and reducing actual and planned high-cost production in the United States and elsewhere.

Within OPEC, and apart from the policies of Saudi Arabia and its Gulf States allies, production developments from several important nations remain conjectural. Consider Iran, Iraq, and Libya. For example, predicting the outcome of the Iranian nuclear negotiations is hazardous. But even if the talks drag out beyond the end of June 2015, they probably will have a relatively successful conclusion resulting in increased Iranian crude oil production. Iraqi output, despite its civil strife, probably will keep rising. Due to the Libyan civil war, production there currently has little room to fall further. Might it spout higher if a peace agreement is reached? Will Nigeria and Venezuela maintain their current production levels?

Noncommercial participants in petroleum playgrounds also influence oil price trends. Over the past several months, a substantial increase in the net noncommercial long position has helped to propel petroleum prices upward. However, given the oversupply situation in the petroleum battlefield, the net noncommercial length arguably is vulnerable. Its liquidation consequently will pressure oil prices lower.

Uncertainties for marketplace variables “outside” the oil patch of course intertwine with those inside it. These factors appear particularly tumultuous and complicated nowadays, making it especially difficult to forecast petroleum price trends and levels. Petroleum supply/demand and prices are hostage not only to economic growth trends, but also to movements in interest rates, stocks, and foreign exchange. Policies of the Federal Reserve, European Central Bank (currently engaged in massive money printing) and other major central banks matter. Will the Fed ever raise interest rates? What if American stocks ever slump more than ten percent? US dollar weakness in the past few weeks probably has supported oil prices. What if the broad real trade-weighted dollar renews its bull move?

FOLLOW THE LINK BELOW to download this article as a PDF file.
Oil's Troubled Waters (5-18-15)

THE PETROLEUM THEATRE © Leo Haviland May 5, 2014

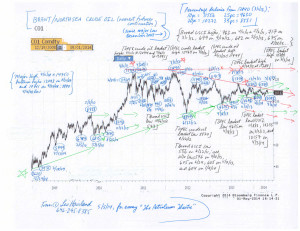
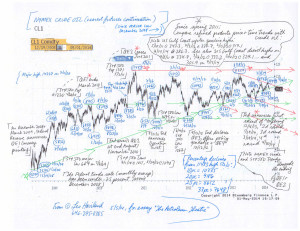
The worldwide petroleum marketplace “in general” will continue its sideways to down trend.

Despite modest global economic growth and forecasts by leaders such as the International Monetary Fund for further expansion, despite sustained highly accommodative monetary policy by the Federal Reserve Board and its allies, look at petroleum price benchmarks such as NYMEX and ICE Brent/Sea crude oil contracts (nearest futures continuation), as well as at US Gulf Coast regular gasoline and diesel. These gradually have retreated from their 2011/2012 peaks.

Note the similar weakness in emerging stock marketplaces “in general”, including China’s. Indeed, Chinese economic growth probably is significantly less than many believe. Given China’s major role in the world commodities arena, that portends further weakness in the overall commodities universe (see the S+P broad GSCI or other indices) and petroleum in particular.

Moreover, the Federal Reserve continues to taper its gargantuan bond buying (money printing) program. Ceasing money printing in 2010 and 2011 encouraged United States equity (use the S+P 500 as a benchmark) and commodity (and emerging stock) marketplace weakness. Though history may not repeat itself, the Fed’s ending of this round of quantitative easing probably will maintain the current sideways to down pattern in the petroleum complex. In recent years, the S+P 500 and commodities “in general” (including the overall petroleum complex) have tended to make noteworthy marketplace turns around the same time. Though the S+P 500 of course continued its bull move since spring 2011 while commodities in general moved in sideways to down fashion, this timing turning point relationship since spring 2011 has tended to persist.

Moreover, overall OECD petroleum industry inventories probably are slightly high, with total US days coverage several days above average. Supply/demand estimates for calendar 2014 indicates that global oil stocks will not decline much if at all this year.

1

2

FOLLOW THE LINK BELOW to download this article as a PDF file.
The Petroleum Theatre (5-5-14)
Charts- NYMEX and Brent crude oil