GLOBAL ECONOMICS AND POLITICS
Leo Haviland provides clients with original, provocative, cutting-edge fundamental supply/demand and technical research on major financial marketplaces and trends. He also offers independent consulting and risk management advice.
Haviland’s expertise is macro. He focuses on the intertwining of equity, debt, currency, and commodity arenas, including the political players, regulatory approaches, social factors, and rhetoric that affect them. In a changing and dynamic global economy, Haviland’s mission remains constant – to give timely, value-added marketplace insights and foresights.
Leo Haviland has three decades of experience in the Wall Street trading environment. He has worked for Goldman Sachs, Sempra Energy Trading, and other institutions. In his research and sales career in stock, interest rate, foreign exchange, and commodity battlefields, he has dealt with numerous and diverse financial institutions and individuals. Haviland is a graduate of the University of Chicago (Phi Beta Kappa) and the Cornell Law School.
Subscribe to Leo Haviland’s BLOG to receive updates and new marketplace essays.

The broad real trade-weighted United States dollar probably will remain weak. Continuing its major long run bear trend from its March 2009 high, it probably will challenge its record low of July 2011. Why?
Among assorted bearish factors, focus on two which are becoming increasingly significant. First, the Federal Reserve Board in its September 2013 meeting displayed its absence of a genuine forward guidance plan and a lack of an authentic comprehensive exit strategy. Thus marketplace faith in the Fed has declined and will do so further in the aftermath of that September gathering. Keep in mind that feeble (vague) Fed guidance and decreased confidence in the Fed occurs amidst ongoing (and long-running) gigantic money printing and interest rate repression. The central bank is doggedly determined to keep pinning the Federal Funds rate near the floor (and thus below current inflation rates and announced Fed inflation targets) for some time. So how attractive are and will be United States Treasury yields for much over much of the government yield curve? Second, America’s national political players currently display weak fiscal (economic) leadership, especially as the debt ceiling limit beckons.
The Federal Reserve Board’s overall exit strategy for its extraordinary sustained accommodative policy remains far more a sketch than a complete design or coherent practical plan. Prior to its September 2013 assembly, central bank communicators strongly hinted the Fed soon would reduce its massive money printing campaign. Yet the illustrious Federal Reserve Board generals surprised the great majority of observers by not cutting back on quantitative easing. Moreover, these Fed luminaries also underlined their flexible attentiveness to a wide array of intertwining variables which will influence their tapering and other decisions. The ever-watchful Fed thus implicitly demonstrated that its loudly-proclaimed forward guidance wordplay offers Fed watchers at best only modest enlightenment and direction. America’s central bank consequently did more than increase marketplace uncertainty. The Fed wounded its own marketplace credibility. By damaging its credibility, the Fed reduces the widespread belief that it can engineer or at least significantly influence “good” economic outcomes.
Unfortunately, the significant shortfall in forward guidance from the guiding lights at the Federal Reserve currently coincides with a badly fractured American national political scene. Of course politicians and parties disagree and compete vigorously. Yet in the United States in recent years, significant philosophical divisions, diverse and often well-entrenched interests, and quests by political players to capture attention and win elections have combined to create ongoing “overall” feeble national political leadership. Strong political individuals in combination do not necessary make a strong collective group.
Failing to satisfactorily resolve the funding and (especially) the debt ceiling issues (and related deficit spending questions) will call in question America’s political leadership as a whole. All else equal, growing doubts about the quality of that leadership (and related fiscal policies) tend to undermine confidence in the US dollar. Besides these current feuds, America’s national political leaders continue to make no progress in resolving or even significantly mitigating the country’s looming long run fiscal deficit problem. Debt crises do not occur only in emerging or developing nations or in countries on the European “periphery”.
FOLLOW THE LINK BELOW to download this market essay as a PDF file.
Forward Guidance and the US Dollar (9-23-13)
The broad real trade-weighted United States dollar (TWD) not only will remain relatively weak, but also it probably will test its July 2011 bottom around 80.5 in the relatively near future.
Within and between currency, interest rate, stock, and commodity domains, observers debate marketplace intertwining, convergence/divergence, and lead/lag relationships and issues. In any event, since the economic crisis walked onto the world stage in mid-2007, and especially after its acceleration during 2008, many marketplace gurus ardently have promoted the guideline that a “weak US dollar equals strong US (and many other) stock marketplaces, strong dollar equals weak US stocks”. This beloved relationship probably no longer holds. In the current theater, the weak US dollar (and any further deterioration in it) now probably translates into falling American stock marketplace prices (use the S+P 500 as a benchmark). In addition, a still-relatively weak TWD (one not sustaining a venture much above its June 2012 peak at 86.3) will not bolster equities much if at all.
In recent months, and especially in the past several weeks, US dollar cross rates have displayed competing perspectives regarding dollar strength. Thus the dollar sometimes appears to be walking a tightrope. The US dollar has rallied recently against the currencies of many developing (and some rather developed) nations and assorted emerging marketplace nations. Several of these domains represent key commodity producers. However, the US dollar has eroded in recent weeks against the currencies of several of its major trading partners such as the Japanese Yen and Euro FX. The dollar remains relatively feeble against the Chinese renminbi as well. This weakness in these key crosses underlines not only the current weakness in the TWD, but also warns that the TWD is quite vulnerable to renewed declines. Moreover, falls of the US dollar in these key crosses (as does the weakness in the TWD in general) indicate that further declines in the US stock marketplace loom ahead (despite the Federal Reserve’s longstanding accommodative policies.
This viewpoint on intertwined US dollar and US equity weakness fits the stories of the dive in emerging marketplace equities (which began in 4/27/11; the “MSCI emerging stock markets index”/MXEF at 1212) and the fall in commodity prices (broad Goldman Sachs Commodity Index’s major downtrend commenced in spring 2011 with the 4/11 and 5/2/11 highs at 762), as well as the bear trend in US government notes. Yields for the 10 year UST bottomed 7/25/12 around 1.38pc; they established other important floors at 1.55pc (11/16/12) and 1.61pc (5/1/13). Note the fall in the MXEF from its 5/9/13 high around 1065 alongside the rise in US rates (especially from the 5/1/13 depth) in the context of the slump in many emerging/developing/commodity producing marketplace cross rates versus the dollar. Keep in mind the timing links (similar directional moves) in recent years between the MXEF and the S+P 500 (even though the S+P 500 climbed to new highs after spring 2011). The renewed faltering in emerging stock marketplaces in recent weeks warns of a notable fall in the S+P 500.
The S+P 500’s high on 5/22/13 near 1687 probably represents (or is very close to) a very significant high.
FOLLOW THE LINK BELOW to download this market essay as a PDF file.
Seeking Directions- US Dollar Retreats, Advances, and Relationships (6-14-13)
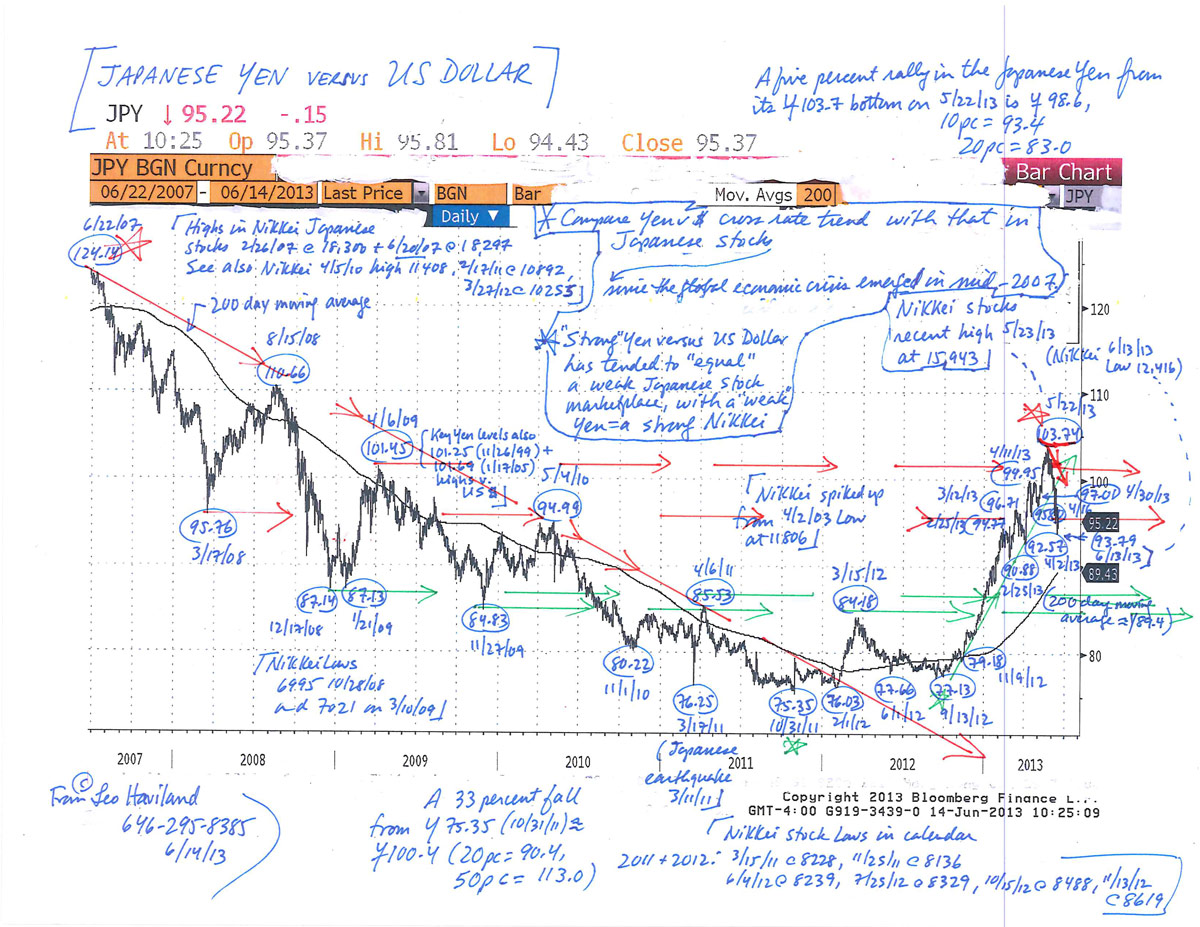
Japanese Yen versus US Dollar Chart (6-14-13)
Currency war fears and realities often reflect widespread economic crisis worries. From time to time during the ongoing international economic crisis that emerged in 2007, marketplace wizards and political sages have warned of currency wars. Many such observers label and bemoan currency battles as “bad”, especially if such competitive devaluations involve several key trading nations around the globe. Nevertheless, many countries view devaluation of their home currency (whether “in general”, or in a cross rate against another nation) as “good”, at least so long as such tumbles are “not excessive”. Might depreciation boost exports and thus help to generate the blessings of growth? Or, might depreciation (at least up to some point) reduce the burden of outstanding debt obligations denominated in the home currency? Thus, in some realms (or at least for powerful economic camps within such territories), depreciation (and sustained currency weakness) ironically often is akin to a military victory.
In recent months, the US dollar and Japanese Yen have fallen, the Yen especially dramatically. However, the greenback already was feeble from a longer run historical vantage point, and its erosion has been rather steady since around June 2012. In America, the Federal Reserve and many politicians clearly endorse a relatively weak dollar. Look at the Fed’s massive and sustained money printing and rock-bottom Federal Funds rate. Have American economic generals in recent months been shouting about the merit of a “strong dollar”? The recent Japanese election and political pressures has accelerated the Yen’s weakness that emerged during 2012.
A weak US dollar in recent years often has been associated with bullish moves for US equities (S+P 500). Recent Yen weakness helped to rocket Japanese equities (Nikkei 225) sharply higher from their 6/4/12 (8240) and 10/15/12 (8490) valleys. The Yen’s weakness began from a so- called very strong level, so perhaps its decline will enhance Japan’s economic growth. Will this Japanese expansion, if it occurs, do so at the expense of others? Perhaps.
For the US, the broad real trade-weighted dollar probably will challenge its July 2011 record low depth in the relatively near future. A decisive breach of that bottom would not be surprising. A challenge of the July 2011 low, and therefore a break beneath it, probably would not be bullish for the S+P 500.
FOLLOW THE LINK BELOW to download this market essay as a PDF file.
Currency Wars, Dollar and Yen Slides (2-1-13)
Petroleum is a key part of the broad GSCI and many other commodity indices. Of course not all commodities travel in the same direction, for they have diverse supply/demand situations. And marketplace timing relationships are not precise; commodities (even within a specific sector such as petroleum) do not all embark in a bull or bear trend at or around the same time. The overall petroleum complex, a key chapter in the commodities in general story, nevertheless has marched more or less alongside the S+P 500.
Each of the assorted petroleum spreads has its own supply/demand variables. Picture a front-to-back intramarket NYMEX crude oil spread or a US Gulf Coast gasoline crack (refining margin) spread. An analytical connection portraying a relationship between petroleum spreads to the S+P 500 and economic recovery (decline) and Federal Reserve policies may seem to be a fairly long stretch.
Yet the price and time movements of one or more important petroleum spreads often “confirm” or warn of changes in outright price trends in the overall petroleum price complex (and its individual marketplaces such as Brent/NSea crude oil, or US Gulf Coast gasoline). So in a web where flat price petroleum patterns generally (roughly) coincide with those of the broad GSCI, trends in oil spreads offer guidance to the broad GSCI trend. Given the rather close bull (and bear) shifts between the GSCI and the S+P 500, petroleum spreads therefore sometimes can offer insight into S+P 500 trends (and into US and international economic growth trends as well). And so Federal Reserve policies tie into some petroleum spread marketplaces. Keep in mind, however, that perceived connections between petroleum spreads and these other domains are only guidelines, and they are not unchanging. Read the rest of this entry »


 View Leo Haviland’s profile