GLOBAL ECONOMICS AND POLITICS
Leo Haviland provides clients with original, provocative, cutting-edge fundamental supply/demand and technical research on major financial marketplaces and trends. He also offers independent consulting and risk management advice.
Haviland’s expertise is macro. He focuses on the intertwining of equity, debt, currency, and commodity arenas, including the political players, regulatory approaches, social factors, and rhetoric that affect them. In a changing and dynamic global economy, Haviland’s mission remains constant – to give timely, value-added marketplace insights and foresights.
Leo Haviland has three decades of experience in the Wall Street trading environment. He has worked for Goldman Sachs, Sempra Energy Trading, and other institutions. In his research and sales career in stock, interest rate, foreign exchange, and commodity battlefields, he has dealt with numerous and diverse financial institutions and individuals. Haviland is a graduate of the University of Chicago (Phi Beta Kappa) and the Cornell Law School.
Subscribe to Leo Haviland’s BLOG to receive updates and new marketplace essays.

Currency marketplace watchers generally concentrate their attention on important cross rate relationships such as the US dollar against the Euro FX, Canadian dollar, Japanese Yen, or Chinese renminbi. However, broad real currency indices (trade-weighted or effective exchange rate) offer greater insight regarding the actual overall strength (or weakness) of any given currency than does a particular cross rate. Thus the broad real trade-weighted dollar is a more comprehensive benchmark for “the dollar in general” and its relationship with debt, stock, commodity, and other arenas.
As the Goldilocks Era faded and the dreadful worldwide economic disaster of 2007-09 unfolded, not only did US Treasury yields collapse alongside massive falls in the S+P 500, emerging marketplace equities, and commodities. During the darkest times of that global financial crisis, the broad real US dollar, Japanese Yen, and Chinese renminbi all appreciated sharply.
Though the renminbi has advanced relative to the dollar since around late April 2014, the broad real (effective exchange rate) yardsticks for both the renminbi and the dollar have rallied together (moved upwards) in recent months (since around mid-2014). In contrast to these bull moves in broad real exchange rates for the renminbi and the dollar, Japan’s real effective exchange rate weakened further in recent months. Moreover, despite the Yen’s depreciation, this simultaneous recent strength in both the dollar and the renminbi overlaps with (confirms) declines in UST 10 year yields and slumps in emerging marketplace stocks and commodities. In this context, in a world of interrelated marketplace battlefields, and given the increasing importance of China in the international economy, the hand-in-hand (joint) rally in the broad real dollar and renminbi indices also warns that a notable top in the S+P 500 may soon emerge.
The recent declines in the Yen and the Euro FX probably hint that the worldwide economy is weakening, not strengthening. Note too the indications of a slowdown in China’s enviable GDP growth rate. In this context, dramatic falls in currencies such as the Russian ruble also can signal or spark potentially more widespread weakness.
The upward trends in the broad real trade-weighted dollar and the renminbi real effective exchange rates probably will continue. For the near term, the Yen’s effective exchange rate probably will remain relatively weak. However, if the world economic situation worsens significantly relative to the current scene, since the Yen appreciated very sharply during the 2007-2009 crisis, the Yen may depart from its current bearish path and venture somewhat higher.
FOLLOW THE LINK BELOW to download this article as a PDF file.
Currency Contexts- Recent Rallies in the Dollar and Renminbi (11-9-14)
Chart- Chinese Renminbi (11-9-14, for essay Currency Contexts)
The recent advance in America’s broad real trade-weighted dollar index has attacked June 2012’s 86.3 high (Federal Reserve Board, H.10; March 1973=100, monthly average). That key top rests near August 2008’s 86.7, a level from which the dollar rallied sharply during the worldwide economic disaster that emerged in mid-2007 and accelerated during 2008. The broad real trade-weighted dollar (“TWD”) probably will climb higher (even if only modestly) over the next several months given the current trends in the US Treasury 10 year note, emerging stock marketplaces, and commodities in general. For these present-day marketplaces and their interrelations, keep in mind their 2007-2009 history. Moreover, the current level and probable near term climb in the TWD, when viewed in conjunction with trends in the UST 10 year and emerging stocks and commodities, indicate that a significant plateau in the S+P 500 is or soon will be in place. A walk in the TWD toward or above September 2008’s 88.8 (and especially) October 2008’s 93.9 increases the likelihood of a noteworthy S+P 500 peak.
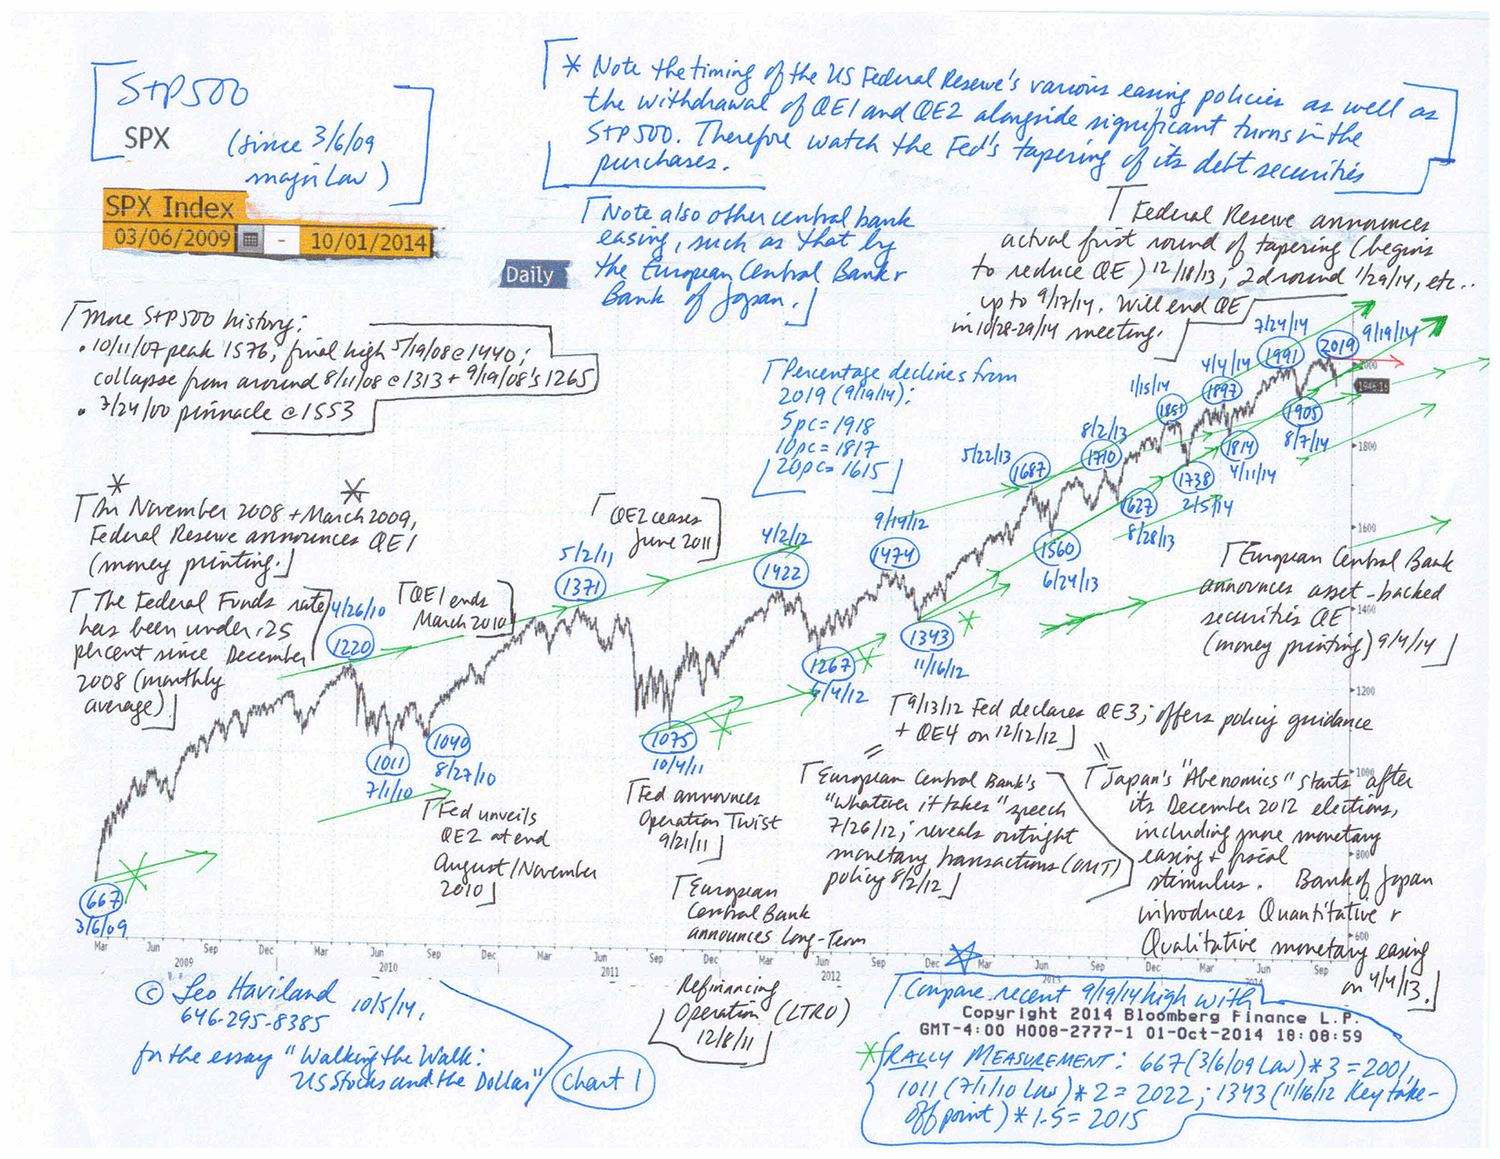
After the Fed ceased its prior rounds of money printing, the 10 year UST note yield and the S+P 500 tumbled. Although that benevolent central bank embarked on a slow tapering process in mid-December 2013, America’s 10 year government note yields have meandered downhill from 1/2/04’s 3.05 percent top. Shouldn’t US longer term government interest rates tend to rise if significant real GDP growth or widespread hopes for it exist? In an interdependent international economy, the ongoing sideways to down trend in emerging marketplace stocks in general warns of slowing growth in advanced as well as developing nations. The retreat in the overall commodities complex roughly resembles that of emerging marketplace equities.
Are owners of US stocks complacent? Not only do many players in stocks and elsewhere have faith in the Fed. Over the past year and a half, the S+P 500’s percentage declines have been even smaller and of increasingly short duration. This probably has mitigated marketplace fears of a large stock retreat.
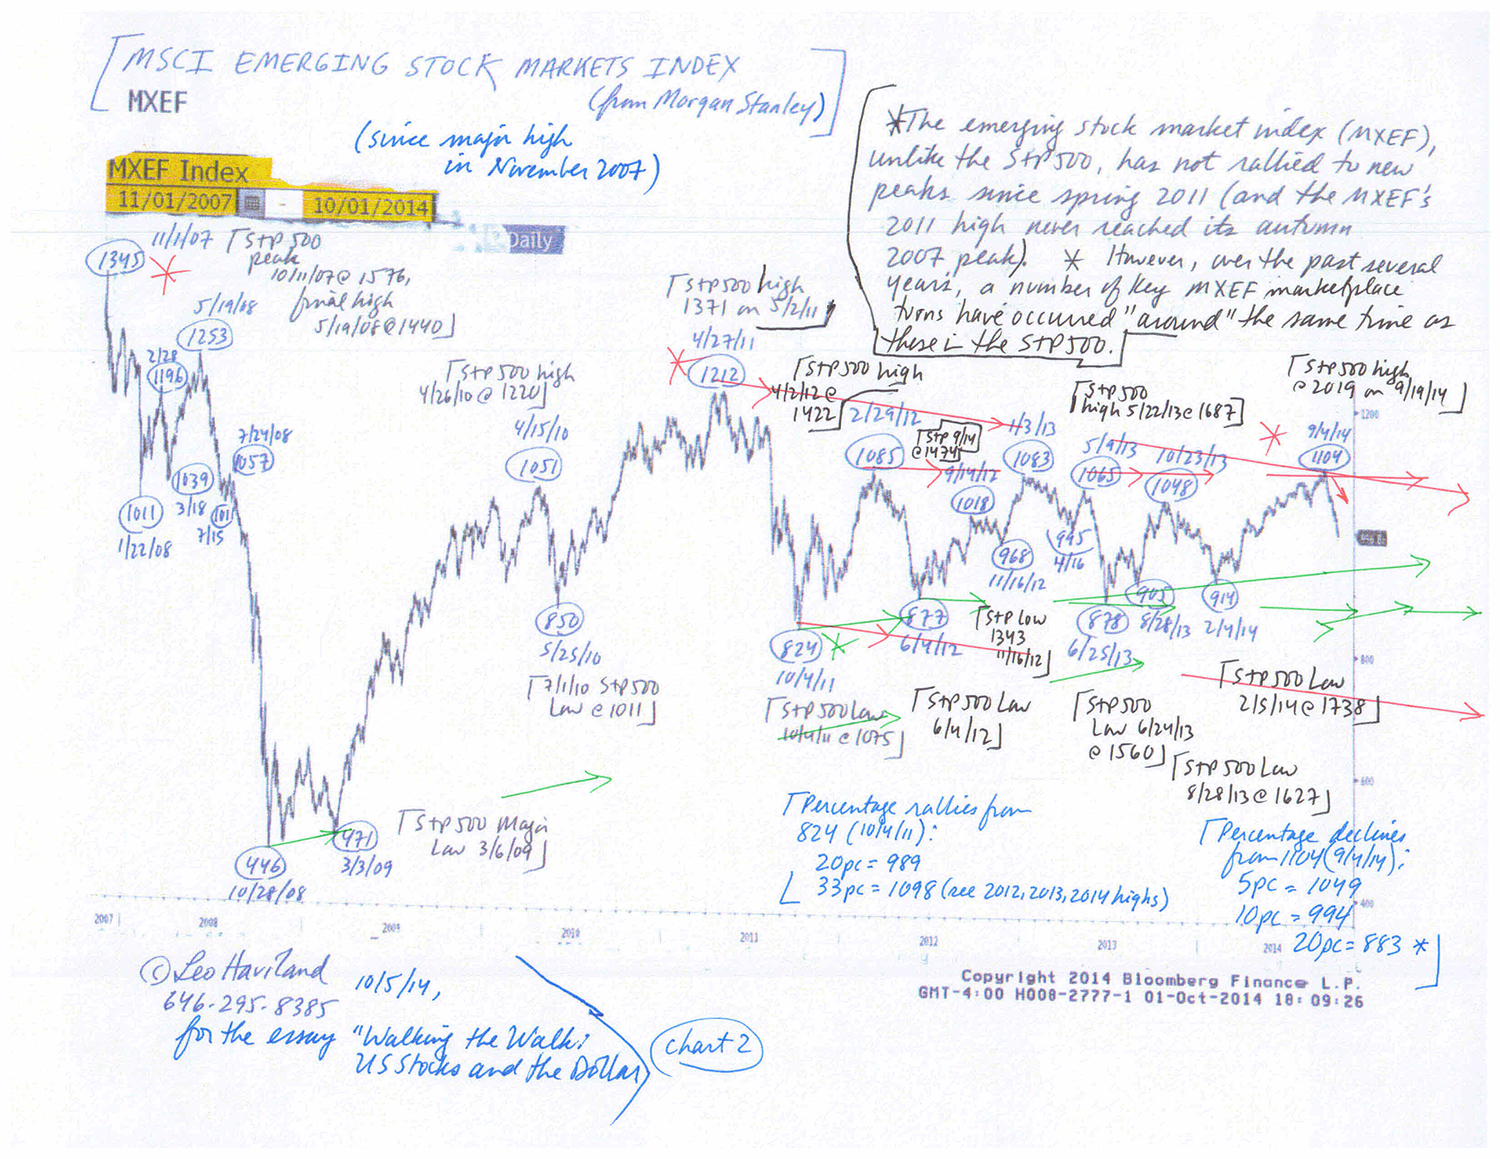
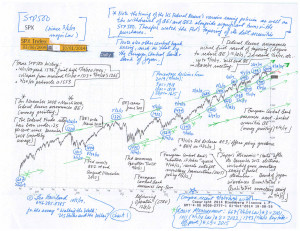
Measurement moves hint that the S+P 500 probably does not have much more room to travel upward for the near term relative to 9/19/14’s recent high at 2019. The 3/6/09 major low around 667*3 equals about 2000. The 7/1/10 low at 1011 times two is 2022. The key take-off point of 1343 on 11/16/12 (various renewed easing by the ECB, Fed, and Bank of Japan within several months before or after that date) times 1.5 is 2015. All these levels are around the recent high. Also, within the context of the current long run bull move in the S+P 500, October is an important anniversary month. Recall 10/11/07’s major peak 1576 and the significant 10/4/11 bottom at 1075.
FOLLOW THE LINK BELOW to download this article as a PDF file.
Walking the Walk- US Stocks and the Dollar (10-5-14)
Charts- S+P 500 and emerging stock marketplace index (10-5-14, for essay Walking the Walk- US Stocks and the Dollar)
Financial marketplaces provide players not only opportunities for profit (and loss), but also entertainment and excitement. Communities across America just finished observing thrilling Fourth of July holiday fireworks displays. Yet in contrast to this explosive holiday festivity, financial marketplace stargazers should underline the comparatively peaceful current trends of assorted iconic national benchmarks.
The United States government 10 year note established a major low in July 2012. However, for the past year or so it has been range bound. The broad real trade-weighted US dollar and commodities in general (enlist the broad Goldman Sachs Commodity Index as a signpost) also have traveled sideways, but for an even longer span. What about stocks? The S+P 500 has skyrocketed, nearly tripling since its 3/6/09 major bottom at 667, blasting higher from such interim lows as 10/4/11’s 1075, 11/16/12’s 1343, and 6/24/13’s 1560. But although the S+P 500 has continued to fly upwards and amaze audiences, the S+P 500’s key VIX volatility measure recently nevertheless has plummeted almost to ground level.
The past and ongoing determination of central bankers around the world, not just the Fed, to create sufficient inflation probably will play a key part in causing American government interest rates to rise and break out of their sideways trend. Deflation (or too low inflation) will be battled no matter what! Fearful “flights to quality” (as into the US or German sovereign debt marketplaces) must be remedied! But how eager will be people sitting on US Treasury and other interest rate instruments with rather low yields to keep doing so as rates climb? Foreigners have a huge stake in the trillions of dollars of US Treasury debt.
The Fed’s massive money printing and bloated balance sheet should make viewers cautious that they can guide marketplaces to happy results. Besides, its exit strategy rhetoric to date falls well short of a coherent detailed plan. How alert was that guardian before and during the early stages of the worldwide crisis that emerged in mid-2007 and erupted in 2008? Also, despite America’s economic growth, the nation as a whole (not just the federal government) still has enormous overall debt relative to GDP. Moreover, substantial actions to solve its long run federal debt problems remain a distant dream.
Read the rest of this entry »
FOLLOW THE LINK BELOW to download this article as a PDF file.
Financial Fireworks (7-7-14)
Charts- Ten Yr UST, S+P 500, GSCI (7-7-14, for essay Financial Fireworks)
The S+P 500 high on 4/4/14 at 1897 probably is an important top. “US Stocks: Shadows and Signals” (2/3/14) remarked that “during the darkest days of the worldwide economic crisis of late 2008/early 2009 as well as during the subsequent recovery, Federal Reserve Board easy money policies have played key roles in encouraging bull moves in the S+P 500 (and many other equity playgrounds). Likewise, the elimination of some of these schemes, particularly previous rounds of quantitative easing (money printing), has occurred alongside highs in American stock benchmarks. What does tapering foreshadow? The Fed’s recent decision to reduce (taper) and eventually eliminate the current gigantic round of money printing warns that a notable top is or relatively soon will be in place.”
As it has in the past, the Federal Reserve will try to prevent a substantial stock marketplace tumble. But unless the S+P falls around ten percent, they probably will say or do little of note. However, if the S+P dives ten percent or more, the Fed lions probably will roar about their determination to sustain recovery. A slump of about 20 percent from a peak (especially if it occurs quickly) boosts the chances that they will slow their current tapering program.
Within and across fields such as stocks, interest rates, currencies, commodities, and real estate, the ardent hunt for sufficient “yield” by “investors” and others never ceases. Recall the glorious Goldilocks Era which preceded the worldwide economic disaster that emerged in mid-2007 and accelerated in 2008. As the Goldilocks Era neared its end prior to those dreadful days, packs of marketplace players eagerly foraged around in diverse (and sometimes very remote or complex) landscapes for adequate yield (good “investment” opportunities; fine returns). The global economic recovery began around mid 2009, with calendar year real GDP growth resuming in 2010. Over the most recent year or two in financial marketplaces (and especially currently), as during the late stages of the Goldilocks Era, the search for yield increasingly has become widespread and rabid. Such sustained heated quests, when reviewed alongside other indicators, warn of economic dangers.
FOLLOW THE LINK BELOW to download this article as a PDF file.
Money Jungle (4-14-14)
Charts- S+P 500 and others (4-14-14, for essay Money Jungle)


 View Leo Haviland’s profile