


MARKETPLACE ENTANGLEMENTS: REVISITING 2008 © Leo Haviland December 14, 2014
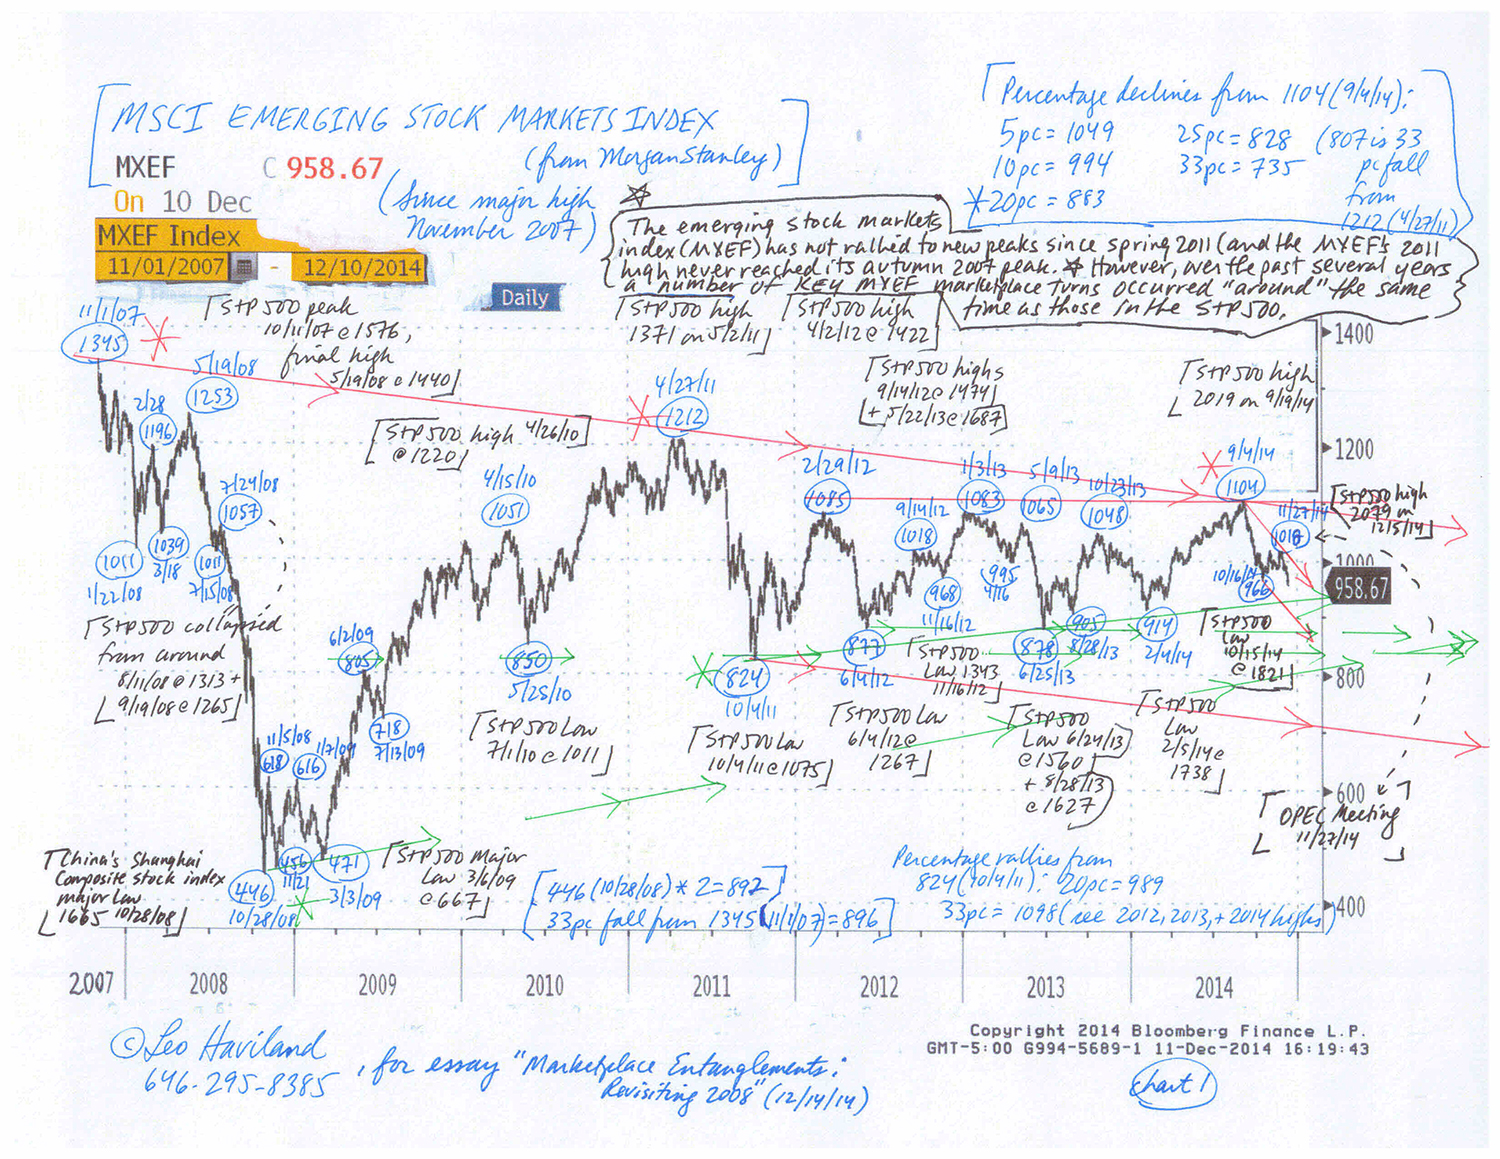
Focus on the current scene for and apparent relationships between the United States Treasury 10 year note, the S+P 500, emerging stock marketplaces (“MXEF”; MSCI Emerging Stock Markets Index, from Morgan Stanley), the United States dollar, and commodities in general (“GSCI”; broad Goldman Sachs Commodity Index). Surely much has changed since the dreadful days of the worldwide economic disaster that emerged in 2007 and accelerated during 2008. One critical difference involves the extraordinary sustained monetary accommodation (notably yield repression and money printing) by the US Federal Reserve Board and its central bank allies in response to the 2007-2009 crisis. Yet arguably many significant debt and leverage problems that developed during the wonderful Goldilocks Era never were solved, merely patched up, downplayed with sunny rhetoric, or postponed. Also, arguably, new debt and leverage problems, partly motivated by the ravenous hunt for yield (return), have walked on the financial stage.
The present marketplace panorama rather closely resembles that of 2008 in many respects. However, the S+P 500 has not yet slumped significantly from its recent high on 12/5/14 at 2079. A notable fall in the S+P 500 from that level nevertheless probably will occur, underscoring (further creating) the parallel with the 2007-08 situation. If the S+P 500 surpasses its December 2014 high, it likely will not do so by much anytime soon. In any event, assuming the major trends underway for these other marketplaces essentially remain intact, the S+P 500 likely will fall significantly, although probably not nearly as dramatically as it did during the 2007-09 span.
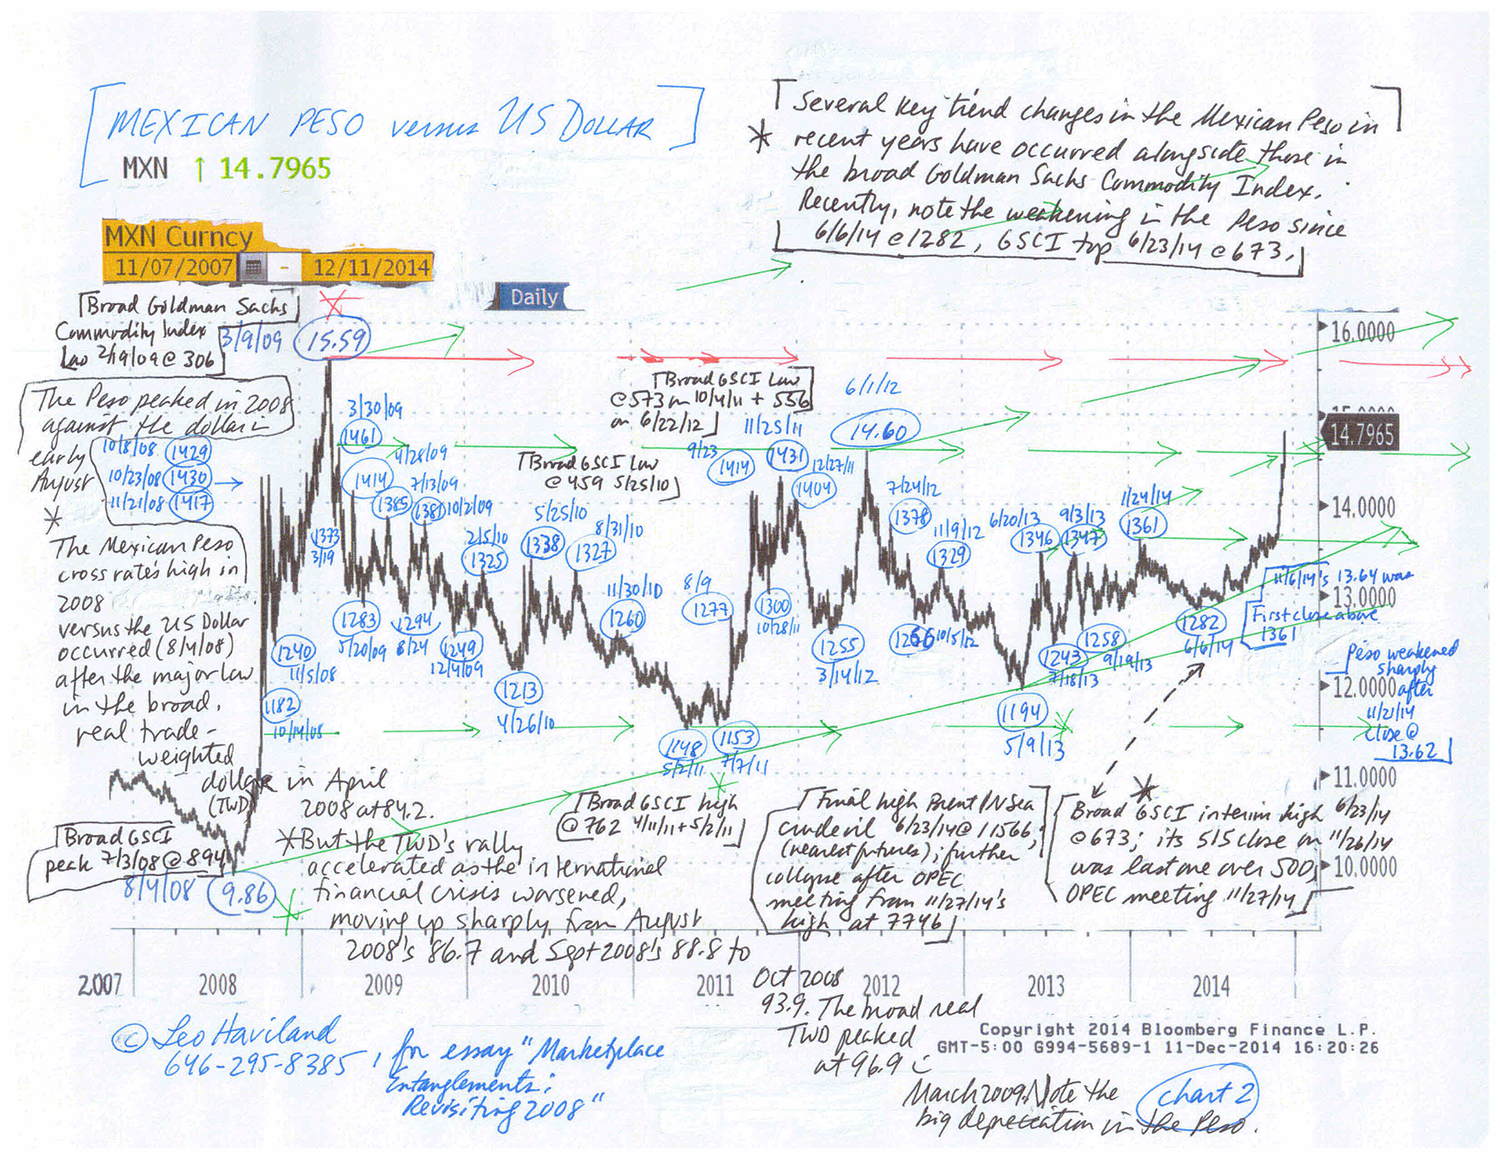
Although cross rates between the US dollar and other currencies are important, the level and trend of the broad real trade-weighted dollar (“TWD”) is a better benchmark for overall dollar strength and weakness.
The broad real TWD created a major low around 80.5 in July 2011. After moving to around 83.5 in September 2011, it meandered sideways for nearly three years, with June 2012’s 86.3 the high during that span.
From about 84.8 in July 2014, it began to edge steadily up (recall the related timing of the UST’s 7/3/14 interim high at 2.69pc and the GSCI’s 6/23/14 high). However, in September 2014, the TWD reached 86.6, thus breaching its June 2012 interim top; for this September 2014 TWD level, keep in mind the MXEF’s top in early September 2014.
The TWD reached 87.6 in October 2014 and 89.0 in November 2014. Its November 2014 level thus edged over September 2008’s TWD bull move take-off point, thus further warning marketplace observers of parallels between current times and the 2007-09 global financial crisis. The stronger dollar, as in 2008, coincides with the bear move in the broad GSCI. Note the MXEF high on 11/27/14 at 1018.
FOLLOW THE LINK BELOW to download this article as a PDF file.
Marketplace Entanglements- Revisiting 2008 (12-14-14)
Charts- Emerging Marketplace Stocks, Mexican Peso (12-14-14, for essay Marketplace Entanglements- Revisiting 2008)