COMMODITY MARKETPLACE TRAVELS (c) Leo Haviland August 1, 2014
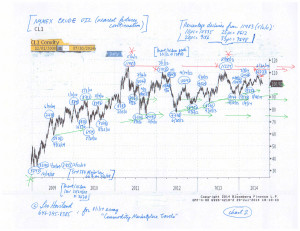
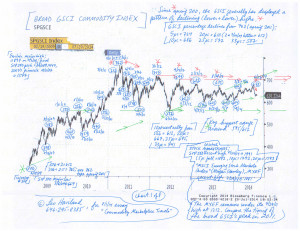
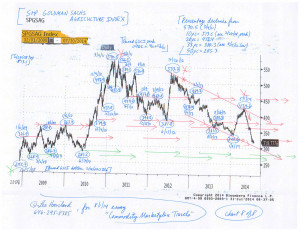
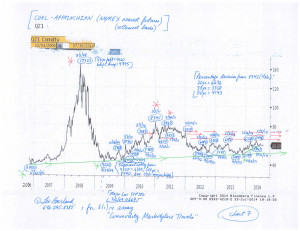
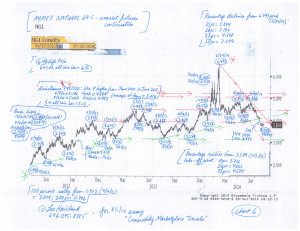
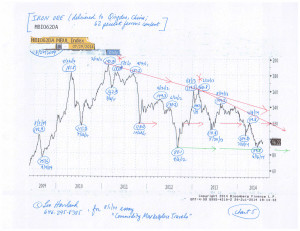
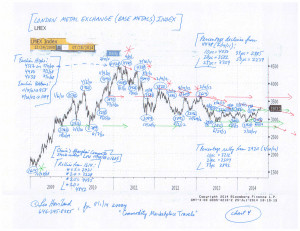
Of course not all commodities (or commodity sectors) move exactly alike. Often their trends (or important turning points within them) dramatically differ. Supply/demand situations vary. However, using the S+P broad Goldman Sachs Commodity Index as a benchmark since 2011, commodities “in general” have traveled sideways, and arguably sideways to down.
Unlike the broad GSCI, the S+P 500 has soared higher relative to its spring 2011 elevation (5/2/11 at 1371). However, like the broad GSCI, emerging stock marketplaces (“MSCI Emerging Stock Markets Index”; MXEF, from Morgan Stanley) remain under their spring 2011 peak (4/27/11’s 1212). Yet despite that notable difference between the S+P 500 and commodities in general (and the MXEF) trends relative to spring 2011, these marketplaces often have made many price turns in the same overall direction at roughly the same time (as they did for several years prior to 2011).
So in the current context in relation to the S+P 500, underline the broad GSCI’s decline from its 6/23/14 interim top at 673. That occurred a few weeks before the S+P 500’s all-time high to date, 1991 on 7/24/14. Further declines in the broad GSCI would be a bearish warning sign for the S+P 500 (and emerging marketplace stocks). The GSCI has important support around 595/612. Also note 10/4/11’s 573 (S+P 500 bottom 10/4/11 at 1075) and 6/22/12’s 556 (S+P 500 low 6/4/12 at 1267).
FOLLOW THE LINK BELOW to download this article as a PDF file.
Commodity Marketplace Travels (8-1-14)
Commodity Charts (8-1-14, for essay Commodity Marketplace Travels)


