

GLOBAL ECONOMICS AND POLITICS

Leo Haviland provides clients with original, provocative, cutting-edge fundamental supply/demand and technical research on major financial marketplaces and trends. He also offers independent consulting and risk management advice.

Haviland’s expertise is macro. He focuses on the intertwining of equity, debt, currency, and commodity arenas, including the political players, regulatory approaches, social factors, and rhetoric that affect them. In a changing and dynamic global economy, Haviland’s mission remains constant – to give timely, value-added marketplace insights and foresights.

Leo Haviland has three decades of experience in the Wall Street trading environment. He has worked for Goldman Sachs, Sempra Energy Trading, and other institutions. In his research and sales career in stock, interest rate, foreign exchange, and commodity battlefields, he has dealt with numerous and diverse financial institutions and individuals. Haviland is a graduate of the University of Chicago (Phi Beta Kappa) and the Cornell Law School.


Subscribe to Leo Haviland’s BLOG to receive updates and new marketplace essays.

RSS View Leo Haviland's LinkedIn profile View Leo Haviland’s profile


US NATURAL GAS: THE WINTER INVENTORY DRAWING BOARD © Leo Haviland October 1, 2012

Having established a major low at 190 on 4/19/12 (NYMEX nearest futures continuation), natural gas marched sharply higher, reaching significant resistance around 330 (7/31/12). After retreating to 258 (8/29/12), the marketplace renewed its assault on the 330 barrier in late September. Even if prices lose some ground in the near term, and assuming normal weather, a decisive advance above that level, and to at least major resistance hovering at 380 to 415, probably will occur in the next few months. It would not be surprising if the initial assault on 380/415 occurred relatively soon.

But why will prices keep climbing? Admittedly, bears have good arguments. For example, current United States natural gas inventories (9/21/12 stocks of 3576bcf) are up about nine percent year-on-year. Suppose weather is around average for the 2012-2013 winter draw season. An initial review of United States natural gas inventories from a days coverage perspective indicates oversupply for the upcoming draw season.

However, there arguably is less oversupply in the near term than many believe. There seems to have been an upward shift in desired stockholdings from the days coverage vantage point in recent years.

In addition, inventories during winter and at end season 2012-13 probably will be far less excessive than during the preceding draw season. This will tend to excite many bulls.

For the next few months, natural gas production growth appears to be flattening (compare calendar 2012 with 2013). But gas demand increases, assuming sustained higher prices over 330, and maybe a bit cheaper, also may level off.

Yet it seems that natural gas is “looking forward” over a longer horizon than just the next few months (or maybe even calendar 2013). A bullish aura underpinning natural gas “for the long run” derives significantly from the coal plant retirement story (especially in 2014 and thereafter). This enthusiasm (though it may eventually confront supply jumps) thus thereby assists to some extent the bullish near term price trends. Also, nuclear power supplies probably will not increase much anytime soon; some players question how much and how quickly renewable supply will blossom from here.

This longer run bullish natural gas faith (orientation) has an implication for the probable willingness of natural gas producers to short hedge, say at around 380/415, or even 450 and beyond (strategies surely differ for each calendar year). Short hedging at these levels probably will be less than many believe.

What about LNG? The extent of LNG exports is conjectural. However, at quite low prices (picture under 200, maybe even 250), the export appeal rises. Though these floors are much beneath current prices, this story tends to support the upward price bias established in April 2012.

Add a technical bull point from the timing perspective. Many key natural gas (NYMEX nearest futures) marketplace bottoms have been reached in late August and calendar September. This did not occur in calendar 2012, which argues that the new highs being made recently will be surpassed. Also, the minor low around 258 in late August, although not close to the April 2012 depth, nevertheless occurred at a time from which prices often have sprung higher. Thus the quick travel higher of the past several weeks argues for a further upward flight.

FOLLOW THE LINK BELOW to download this market essay as a PDF file.
Natural Gas- the Winter Inventory Drawing Board (10-1-12)
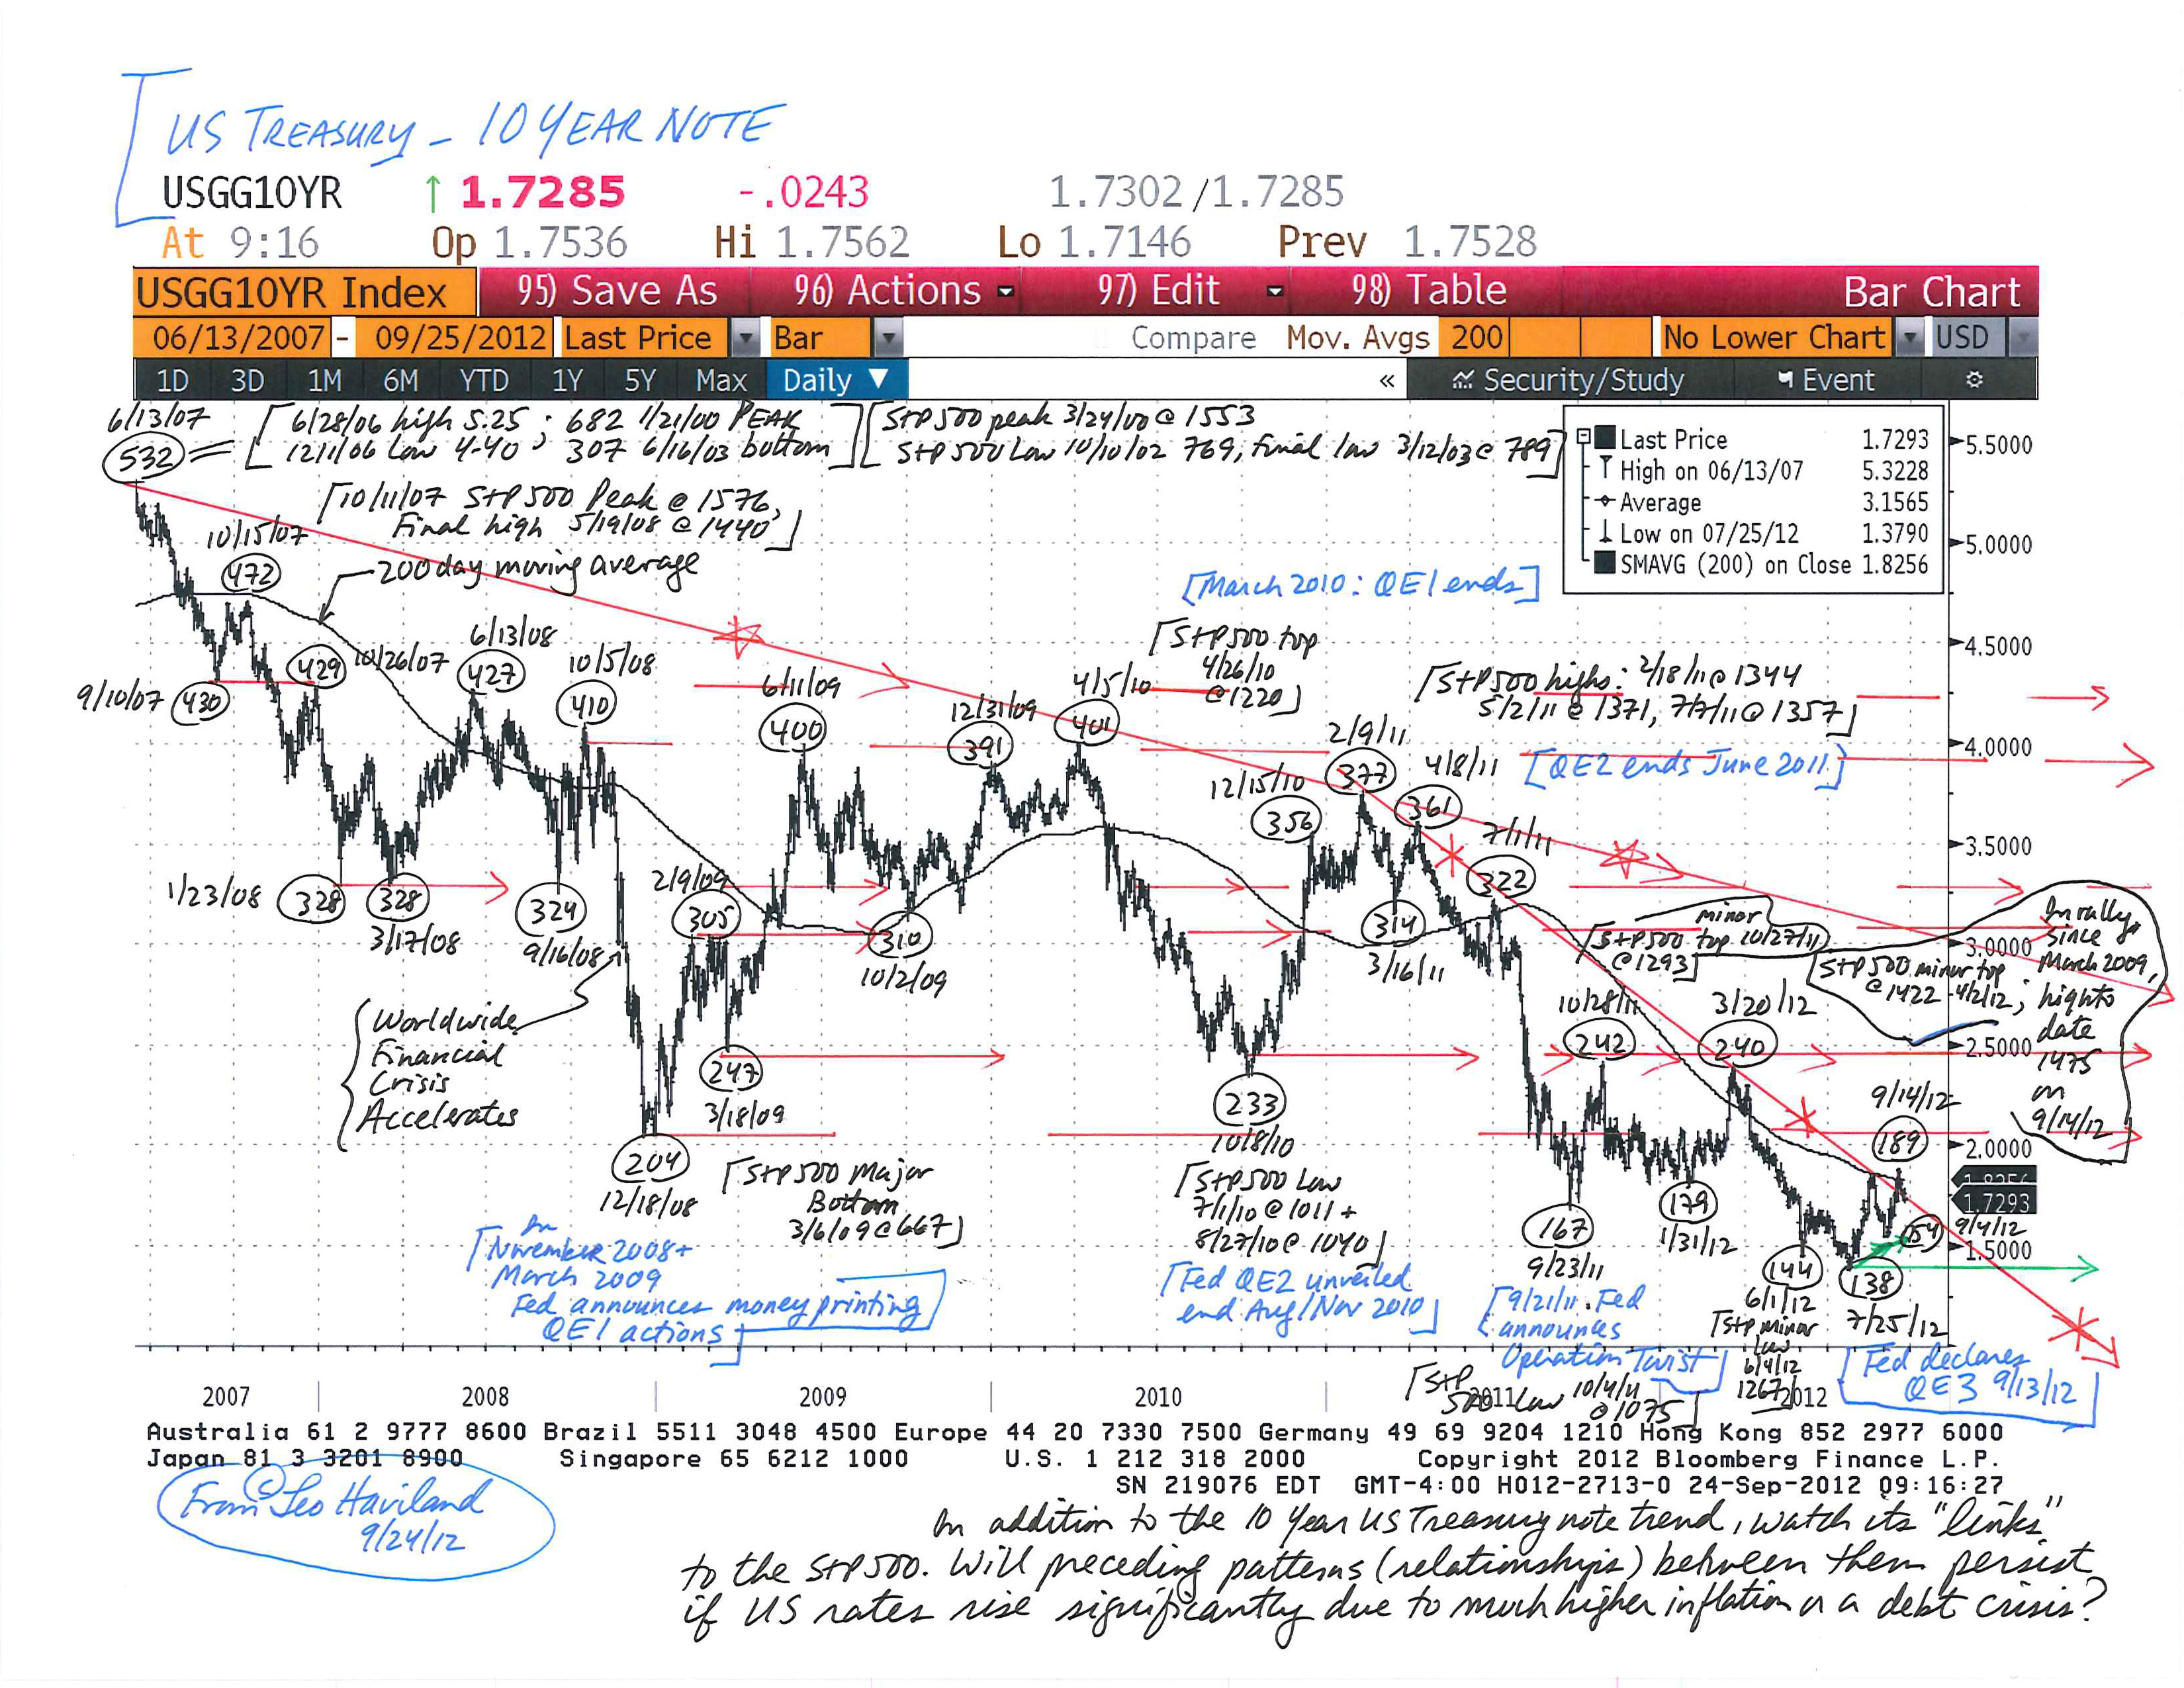
FED FIXATIONS: INTEREST RATES © Leo Haviland September 24, 2012

A key United States interest rate benchmark, the 10 year Treasury note, probably established a major bottom around 1.40 percent in late July 2012.

The Federal Reserve Board’s fixing of the Federal Funds rate at exceptionally low levels admittedly restrains ascents in US government yields. Its benevolent promise and determination to maintain the Funds rate almost flat on the ground until at least mid-2015 encourages faith that government yields generally will remain depressed. Also, heightened flight to quality fears and nervous leaps in recessionary worries may push the 10 year UST challenge back toward or even slightly beneath its July low. The Eurozone crisis, for example, has not disappeared. America’s 2013 federal “fiscal cliff” looms large on the horizon.

However, all else equal, a flood of money printing tends to increase inflation and thus interest rates. And all else equal, cracking or crumbling creditworthiness for a borrower- whether an individual, corporation, or government- tends to boost the interest rate charged that borrower. America nowadays confronts another round of Federal Reserve money printing and has made little headway in resolving its awesome fiscal problems.

The Federal Reserve’s long rumored (fervently hoped for) and recently decreed (9/13/12) third cascade of money printing, QE3, probably will be massive, perhaps over one trillion dollars. Over time, this deluge will help to boost US government (and other) interest rates.

Moreover, given a generous desire to avoid the fiscal cliff and a downturn, Congress probably will continue its huge deficit spending spree. Not only has America become habituated to deficit spending, debt (including personal debt), and assorted forms of entitlement. How many people volunteer nowadays to pay sufficiently more taxes to solve- or at least significantly reduce- near term (as well as long run) national fiscal troubles? For a debtor nation such as America, running substantial budget deficits alongside elevated (and thus expanding) government debt as a percentage of nominal GDP raises the risk of a severe fiscal trial. The arrival of this crisis probably will occur relatively soon rather than at some vague date many years down the road. In any event, this visit will tend to raise US government rates. The US may be an economic fortress, but that does not guarantee that its creditworthiness will be unquestioned or unchallenged. Witness Europe in recent years; also recollect the debt sagas of many emerging marketplaces.

What are key levels for the US Treasury 10 year note? Start at the low end and walk higher.

FOLLOW THE LINK BELOW to download this market essay as a PDF file.
Fed Fixations- Interest Rates (9-24-12)
US Treasury 10 Year Note Chart (9-24-12)

FED FIXES AND DOLLAR DEPRECIATION © Leo Haviland September 17, 2012

The broad real trade-weighted United States dollar will depreciate. Over the next several months, its retreat probably will reach July 2011’s record low around 80.6 (for the nearly four decades going back to 1973, monthly averages; March 1973=100) and break beneath it, with around 77.0 a reasonable target. Over the longer term, a descent to around 72.5 to 75.0 would not be surprising.

We know that all else equal, debtors (and borrowers) want as low an interest rate as they can get.

The Fed’s interest rate policy is (and has been for several years) geared toward aiding debtors (borrowers) at the relative expense of creditors (savers). Since debtors deserve special Fed help, surely the unemployed do.

We know that all else equal, debtors in a home currency (imagine the beloved US dollar) tend to enjoy some modest home currency depreciation. This makes their debt obligations less burdensome to pay off. This perspective assumes that these debtors can keep borrowing fairly easily, and at interest rates that not too high (overly punitive).

However, all else equal, foreign creditors are not enamored of such currency degradation. Foreigners hold an enormous amount of US Treasury securities, nearly $5.3 trillion (as of June 2012,

What happened to the US dollar after the Fed’s prior two massive rounds of quantitative easing? The TWD depreciated.

Significantly, the Fed’s determination to keep interest rates pinned to the floor (and thus offering pitiful returns on government debt relative to inflation) for an extended time period, say out to mid-2015, boosts the odds that its QE3 money flood will help to push the dollar down. In addition, recall that he TWD has been in a declining pattern over the past decade (or longer). So has America’s relative international economic and political prominence. Remember that QE3 is occurring alongside substantial US indebtedness (with a potential federal deficit disaster lurking on the horizon), a noteworthy current account deficit, and only modest domestic savings (compare Japan).

The Fed presumably is aware that the TWD declined after the QE1 and QE2 episodes. So apparently the Fed will tolerate dollar weakness to achieve its employment objectives.

FOLLOW THE LINK BELOW to download this market essay as a PDF file.
Fed Fixes and Dollar Depreciation (9-17-12)

THE GROWTH GAME: US UNEMPLOYMENT AND FEDERAL RESERVE POLICIES (c) Leo Haviland September 10, 2012

Nevertheless, compare the first several years of the US Treasury yield curve relative to current and forecast inflation statistics from the CBO. Real returns look negative. The two year UST note is about .25pc, with the five year UST .65pc (under one percent). So although US inflation has been low, the Fed’s yield repression interest rate policy (whatever its merits), which probably will extend at least through end 2014, tends to cheat savers in UST (and assist the US government debtor- “We, the people”, in a representative government). Lower interest rates for the UST benchmark help to slash yields for (lower real costs for) and thus benefit other debtors/borrowers (state, local, corporate, household). Creditors/lenders correspondingly suffer via reduced real return relative to inflation. Admittedly, marketplace gardeners can argue that the Fed’s current interest rate agenda benefits “all of us” over the long run.

The Fed’s ongoing worries about unemployment in particular (and economic strength in general) underline (reflect) its willingness to suppress policy rates.

Perspectives on the output gap intertwine with analysis of and opinions regarding appropriate employment and unemployment levels. Sustained high unemployment levels may reflect a large output gap, if the economy’s productive potential remains as substantial as most economic wizards believe. However, sustained high unemployment in the face of determined longstanding Federal Reserve easing (and political deficit spending) argues that the output gap (long run productive potential) is significantly less than the IMF and Federal Reserve contend. Suppose the output gap is less than the widespread faith. Then allegedly “normal” (long run) unemployment may be greater than the Fed asserts.

So suppose unemployment unfortunately will tend to remain historically high (above current theories regarding “normal” levels) in part due to the reduction in productive potential (GDP). If so, the Fed’s well-intentioned highly accommodative policies eventually run a noteworthy risk of helping greater than desirable inflation to blossom, even if this takes an extended time to develop.

Current high unemployment levels, as well as trends in some employment measures going back to calendar 2000 (and thus preceding the economic disaster that emerged in 2007), suggest that “normal” unemployment levels probably are quite a bit higher than the Fed and many others believe. If so, America’s productive potential and its output gap also probably are less than the Fed argues.

Dig into some other key employment statistics (from the BLS; Labor Force Statistics from the Current Population Survey). Again look further backward in time than the dawn of the economic crisis in 2007. Like the official and U-6 unemployment data, both the employment-population ratio and the civilian labor force participation rate suggest that there has been a secular decline in America’s “employability potential” and productive capacity.

FOLLOW THE LINK BELOW to download this market essay as a PDF file.
The Growth Game- US Unemployment and Federal Reserve Policies (9-10-12)
