GLOBAL ECONOMICS AND POLITICS
Leo Haviland provides clients with original, provocative, cutting-edge fundamental supply/demand and technical research on major financial marketplaces and trends. He also offers independent consulting and risk management advice.
Haviland’s expertise is macro. He focuses on the intertwining of equity, debt, currency, and commodity arenas, including the political players, regulatory approaches, social factors, and rhetoric that affect them. In a changing and dynamic global economy, Haviland’s mission remains constant – to give timely, value-added marketplace insights and foresights.
Leo Haviland has three decades of experience in the Wall Street trading environment. He has worked for Goldman Sachs, Sempra Energy Trading, and other institutions. In his research and sales career in stock, interest rate, foreign exchange, and commodity battlefields, he has dealt with numerous and diverse financial institutions and individuals. Haviland is a graduate of the University of Chicago (Phi Beta Kappa) and the Cornell Law School.
Subscribe to Leo Haviland’s BLOG to receive updates and new marketplace essays.

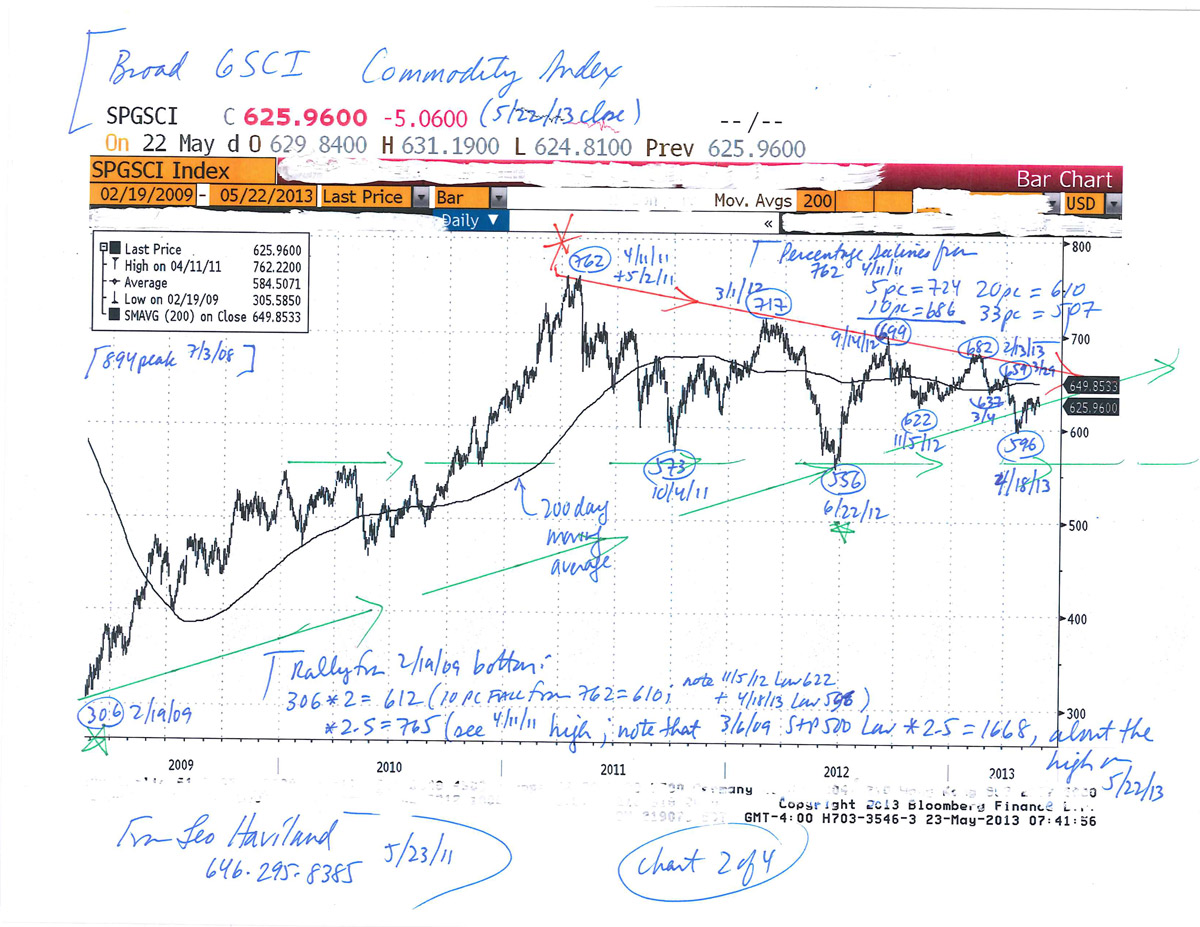
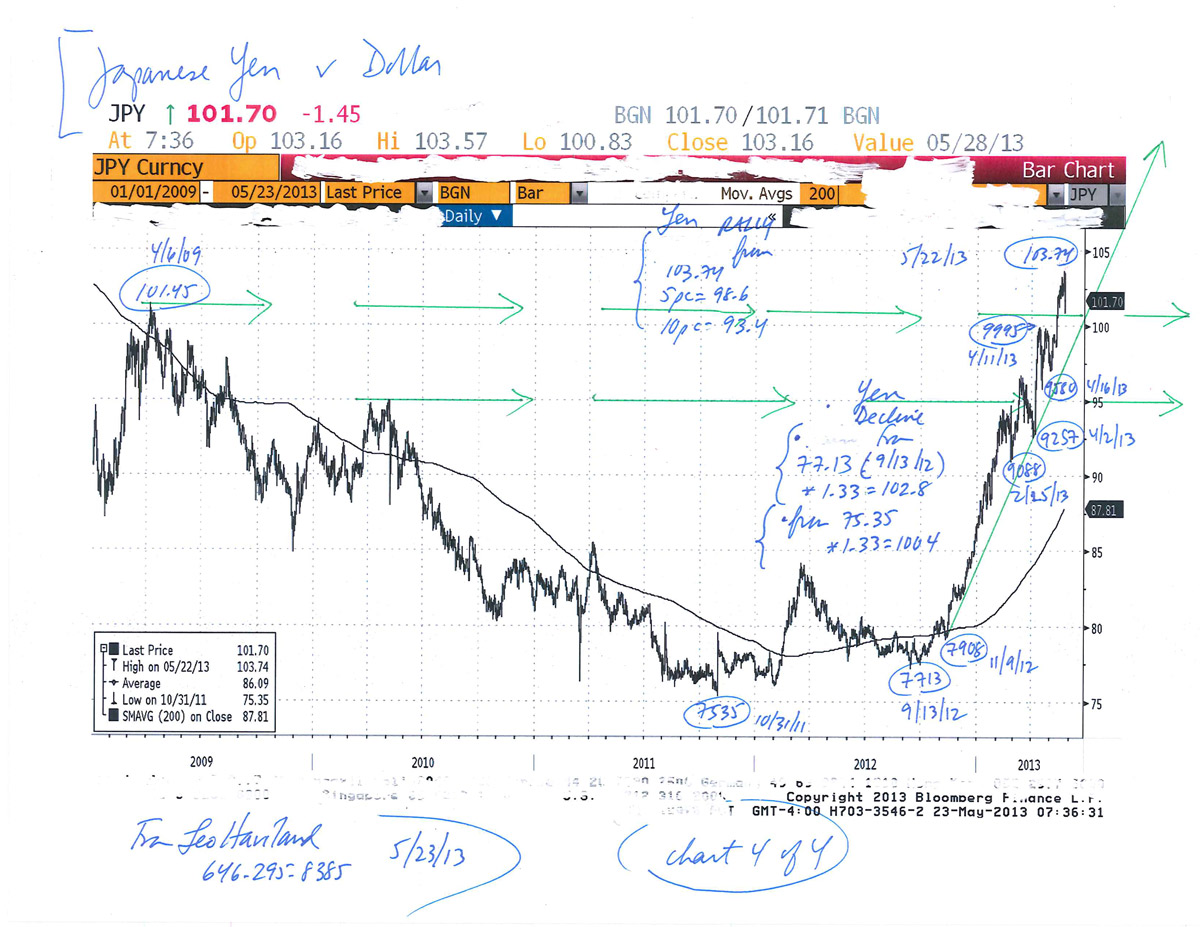
See the following four charts of US stocks (S+P 500), broad Goldman Sachs Commodity Index, Japanese stocks (Nikkei), and the Japanese Yen versus the US dollar.
The S+P 500 chart states: “US Stocks: Finally, a key top (or very close in time to one)” and gives “percentage declines from 1687 (5/22/13)”. It adds: “watch Japanese + European stocks alongside S+P 500”. Note the comments on the other charts.
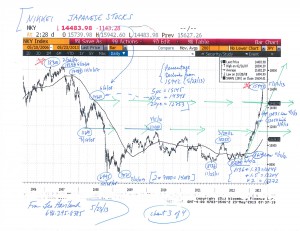
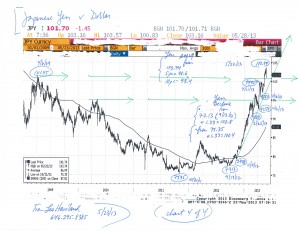
Charts- S+P 500, Broad GSCI, Nikkei, Yen (5-23-13, for US Stocks- Finally, a Key Top essay)
FOLLOW THE LINK BELOW to download this market essay as a PDF file.
US Stocks- Finally, a Key Top (Or Very Close in Time to One) (5-23-13)
The United States natural gas Western Consuming Region, assuming normal weather, probably will end its 2013 build season with inventory around 520bcf to 575bcf. The middle of this range, 545bcf to 550bcf, resides above the 505bcf average peak of the past several years (2006-12) and hovers near 2012 build season’s 551bcf record plateau. Nevertheless, in general this region probably will not face a notable containment problem around the end of 2013 build season. However, containment challenges, even if unlikely, are not out of the picture, particularly if natural gas stocks build more than anticipated and if regional storage capacity has grown very little.
Given increased United States natural gas demand (and supply) since 2006, viewpoints regarding and estimates derived from “average” (normal, typical, desired), “high” and “low” gas inventories should emphasize the 2006-12 time period. However, the long run perspective beginning with 1994 remains relevant. See “US Natural Gas: the 2013 Build Up” (4/25/13), “US Natural Gas Inventory: the Producing Region Scenery” (5/6/13), and “Natural Gas Inventory: the Eastern Consuming Region Build Season” (5/13/13).
All else equal, an average inventory level at the commencement of build season tends to produce average builds. In the WCR as elsewhere in the United States, an elevated natural gas inventory total favors less than average inventory building (in the table above, see 2012 as well as 1995 and 1996 and arguably 2010). A relatively depressed WCR stock amount at the onset of build season encourages greater than normal inventory growth (1998, 2001, 2004, and 2008). Yet this guideline is not absolute, as 2000’s paltry inventory expansion occurred relative to a modest build season start (the 3/17/00 192bcf starting point was almost even with the 194bcf average of the preceding six years of 1994-1999).
FOLLOW THE LINK BELOW to download this market essay as a PDF file.
Natural Gas Inventory- the Western Consuming Region Build Season (5-20-13)
Assuming normal weather, natural gas inventories in the United States Eastern Consuming Region at the end of the 2013 build season probably will range between roughly 2050bcf and 2100bcf. The midpoint of this range, 2075bcf, likely is about “normal” (average) for current United States supply and demand patterns.
Recall that end April 2012 Eastern Consuming Region peak working natural gas storage capacity for the region was 2219bcf. That total probably has been growing modestly since then. The Eastern Consuming Region therefore probably will not face a significant containment issue around the end of build season 2013, even if inventories reach around 2120bcf to 2135bcf.
The May 2013 STEO portrays how ECR year-on-year inventories from 1Q13 to 1Q14 catch up with and eventually surpass prior year levels. This is a bearish sign for gas prices.
Significantly, the 646bcf starting point for 2013 ECR inventory lurks a fair amount beneath the 733bcf average of the 2006-12 time frame. Consequently, the relatively low April 2013 ECR inventory total probably will be followed by a greater than average (relative to the 2006-12 vista) bcf increase.
FOLLOW THE LINK BELOW to download this market essay as a PDF file.
Natural Gas Inventory- the Eastern Consuming Region Build Season (5-13-13)
When United States natural gas 2013 build season ends this autumn, inventories in the key Producing Region probably will be around 1200bcf, plus or minus five percent (1140bcf to 1260bcf range). Based upon historic inventory patterns, especially those of 2006 to the present, most marketplace participants probably would view around 1200bcf as average. Unlike build season 2012, the Producing Region will not confront notable containment issues this year.
Suppose a bear trend for NYMEX natural gas (nearest futures continuation) emerged from the recent highs over 440. One time to look for an important bottom is in late August/calendar September 2013.
Historical review of Producing Region inventory levels and trends alongside NYMEX natural gas price trends and levels reveals a rough pattern. Assume that gas prices establish an important peak. Although the history is relatively brief, there is a seasonal tendency for natural gas prices (NYMEX nearest futures continuation) to establish important bottoms sometime around late calendar August through calendar September and thus in the later stage of Producing Region (and US) build season. See the table above. Several of these lows were major trend change points.
This is a guideline, not a destiny.
FOLLOW THE LINK BELOW to download this market essay as a PDF file.
Natural Gas Inventory- the Producing Region Scenery (5-6-13)


 View Leo Haviland’s profile