GLOBAL ECONOMICS AND POLITICS
Leo Haviland provides clients with original, provocative, cutting-edge fundamental supply/demand and technical research on major financial marketplaces and trends. He also offers independent consulting and risk management advice.
Haviland’s expertise is macro. He focuses on the intertwining of equity, debt, currency, and commodity arenas, including the political players, regulatory approaches, social factors, and rhetoric that affect them. In a changing and dynamic global economy, Haviland’s mission remains constant – to give timely, value-added marketplace insights and foresights.
Leo Haviland has three decades of experience in the Wall Street trading environment. He has worked for Goldman Sachs, Sempra Energy Trading, and other institutions. In his research and sales career in stock, interest rate, foreign exchange, and commodity battlefields, he has dealt with numerous and diverse financial institutions and individuals. Haviland is a graduate of the University of Chicago (Phi Beta Kappa) and the Cornell Law School.
Subscribe to Leo Haviland’s BLOG to receive updates and new marketplace essays.

The Federal Reserve Board continues to stress via its wonderful forward guidance strategy that it will keep policy rates extremely low. However, the sustained rally in United States Treasury government yields shows that marketplace confidence in the Fed’s ability to manage (repress) interest rates, especially at the long end of the yield curve, has fallen. Look at the UST 10 year note. Not only did its yield bottom around 1.38 percent on 7/25/12. Not only did yields climb further from lows near 1.55pc (11/16/12 and 12/6/12). They have spiked from 5/1/13’s 1.61pc, touching 2.75pc 7/8/13. And this spike has continued even after the Fed underlined in recent weeks that it would not “taper” its money printing (and other easy money games) too quickly.
The ability of central bank maneuvers to sustain substantial economic growth (and repress government yields and rally the S+P 500 and related equities) probably has weakened.
Rising sovereign debt yields do not always reflect or portend economic growth (recovery) or higher stock marketplace prices. In the current marketplace playing field, rising interest rates in America (and elsewhere) also seem to be “leading” equity marketplace declines. Suppose the US government 10 year rate marches higher from current levels (or even if it stays relatively high versus its summer 2012 and May 2013 bottoms). Suppose the S+P 500 is unable to exceed (or break much above) its May 2013 height and that it declines beneath its late June 2013 low around 1560. The rising yields and falling equities will underscore that the easy money game of the Fed and its central banking allies increasingly strains credibility and thus has diminished substantially in its effectiveness.
In any event, it nevertheless stretches credibility to claim that these recent ECB and BoE statements represent a change of genuine significance. They appear to be clever ploys to boost confidence in the ability of the central banks to help guide and sustain recovery. How likely was (is) it that the ECB or the BoE were (are) going to raise rates anytime soon? Not only is much of Europe in recession, but Europe’s economic crisis (including sovereign and banking debt and related bailout issues) persists. Noteworthy troubles still loom in Greece, Ireland, Portugal, Cyprus, as well as in Spain and arguably in Italy. Moreover, recall the ECB President’s inspiring “whatever it takes” talk about a year ago (7/26/12); people gave substantial credence to that open-ended proclamation.
Consequently, these recent ECB and BoE remarks, like the cheerleading comments by Federal Reserve and Chinese officials after the June 2013 stock marketplace lows, look like a sign of weakness. Are the ECB and BoE losing some of their hold on the distant section of the yield curve? Yes. Again underscore the steady creep higher in longer run government rates in the United States (and many other arenas) despite keeping Federal Funds near the ground.
Read the rest of this entry »
The S+P 500 trend and level are important variables in Federal Reserve Board decision-making. Recent statements by the Fed hint that for the near term this revered marketplace monitor probably is relatively (increasingly) unwilling to incite rallies beyond the May 2013’s 1687 height. At around the 1475 to 1520 range, the Fed might offer some attention-capturing and enticing aid- even if it is only sweet talk emphasizing its commitment to its beautiful long-lasting easy money regime. The easygoing Fed probably will volunteer notable support to the S+P 500 around 1350, though it nevertheless may await the 1265 to 1315 span before it offers dramatic marketplace help.
However, the Fed nevertheless recently murmurs that it may not remain forever as accommodating. Perhaps it will reduce in the relatively near future the rate at which it now buys UST and mortgage-backed securities. After all, it did quit QE1 and QE2. Moreover, the Fed resumed its pillow talk of its beloved exit strategies lately.
Focus on some of the Federal Reserve Board’s economic rescue measures in recent years in the context of S+P 500 dives.
If the S+P 500 creeps five percent lower, that quite probably will worry the Fed little if at all. However, this economic doorman probably will offer sugarcoated wordplay, and maybe some renewed easing (most likely some incremental money printing), if the S+P 500 falls 10pc. First, note the emergence of talk of easing after the S+P 500 fell from 4/2/12’s 1422 to its 1267 bottom on 6/4/12, a 10.9pc decline. Admittedly the Fed did not uncover QE3 until mid-September 2012, with the S+P price around 1475. The Fed very likely was severely disappointed by the wilting of the S+P 500 from 1475 despite its glorious proclamation of QE3. However, the Fed, after the S+P 500 fell a modest 8.9pc down to 1343 on 11/16/12, not long afterwards opened its easing door more widely with its 12/12/12 policy guidance on inflation and unemployment and a further boost in money printing.
What about a twenty percent S+P 500 fall? Recall the 4/26/10 high around 1220. The Fed ended QE1 in March 2010. This benchmark index reached its bottom on 7/1/10 at 1011, a fall of 17.1 percent; it made a second low at 1040 on 8/27/10. Highlight the gradual appearance on the runway from end August to November 2010 of QE2’s money printing. On 5/2/11, the S+P 500 established a noteworthy interim peak at 1371. QE2 ended in June 2011, alongside this marketplace top. Equity bulls bemoaned the bloody crash in the S+P 500 to 10/4/11’s 1075. As the price fell off the table, and not long before the October low, the Fed ushered in Operation Twist (9/21/11). The rapid deterioration from the May 2011 plateau to the October low was 21.6pc. Since these two falls of around twenty percent apparently helped to prompt Fed action, a twenty percent stumble from any notable pinnacle probably would arouse Fed easing activity. In addition, many marketplace clairvoyants promote the opinion that a twenty percent marketplace plunge defines a bear marketplace. Consequently, the Fed does not want bearish sentiment to accelerate declines in the S+P 500 and thus dampen enthusiasm in the so-called real (wider) economy.

FOLLOW THE LINK BELOW to download this market essay as a PDF file.
The Easygoing Fed- Sweet Talking and Stocks (6-20-13)
S+P 500 Chart (6-20-13)
The broad real trade-weighted United States dollar (TWD) not only will remain relatively weak, but also it probably will test its July 2011 bottom around 80.5 in the relatively near future.
Within and between currency, interest rate, stock, and commodity domains, observers debate marketplace intertwining, convergence/divergence, and lead/lag relationships and issues. In any event, since the economic crisis walked onto the world stage in mid-2007, and especially after its acceleration during 2008, many marketplace gurus ardently have promoted the guideline that a “weak US dollar equals strong US (and many other) stock marketplaces, strong dollar equals weak US stocks”. This beloved relationship probably no longer holds. In the current theater, the weak US dollar (and any further deterioration in it) now probably translates into falling American stock marketplace prices (use the S+P 500 as a benchmark). In addition, a still-relatively weak TWD (one not sustaining a venture much above its June 2012 peak at 86.3) will not bolster equities much if at all.
In recent months, and especially in the past several weeks, US dollar cross rates have displayed competing perspectives regarding dollar strength. Thus the dollar sometimes appears to be walking a tightrope. The US dollar has rallied recently against the currencies of many developing (and some rather developed) nations and assorted emerging marketplace nations. Several of these domains represent key commodity producers. However, the US dollar has eroded in recent weeks against the currencies of several of its major trading partners such as the Japanese Yen and Euro FX. The dollar remains relatively feeble against the Chinese renminbi as well. This weakness in these key crosses underlines not only the current weakness in the TWD, but also warns that the TWD is quite vulnerable to renewed declines. Moreover, falls of the US dollar in these key crosses (as does the weakness in the TWD in general) indicate that further declines in the US stock marketplace loom ahead (despite the Federal Reserve’s longstanding accommodative policies.
This viewpoint on intertwined US dollar and US equity weakness fits the stories of the dive in emerging marketplace equities (which began in 4/27/11; the “MSCI emerging stock markets index”/MXEF at 1212) and the fall in commodity prices (broad Goldman Sachs Commodity Index’s major downtrend commenced in spring 2011 with the 4/11 and 5/2/11 highs at 762), as well as the bear trend in US government notes. Yields for the 10 year UST bottomed 7/25/12 around 1.38pc; they established other important floors at 1.55pc (11/16/12) and 1.61pc (5/1/13). Note the fall in the MXEF from its 5/9/13 high around 1065 alongside the rise in US rates (especially from the 5/1/13 depth) in the context of the slump in many emerging/developing/commodity producing marketplace cross rates versus the dollar. Keep in mind the timing links (similar directional moves) in recent years between the MXEF and the S+P 500 (even though the S+P 500 climbed to new highs after spring 2011). The renewed faltering in emerging stock marketplaces in recent weeks warns of a notable fall in the S+P 500.
The S+P 500’s high on 5/22/13 near 1687 probably represents (or is very close to) a very significant high.
FOLLOW THE LINK BELOW to download this market essay as a PDF file.
Seeking Directions- US Dollar Retreats, Advances, and Relationships (6-14-13)
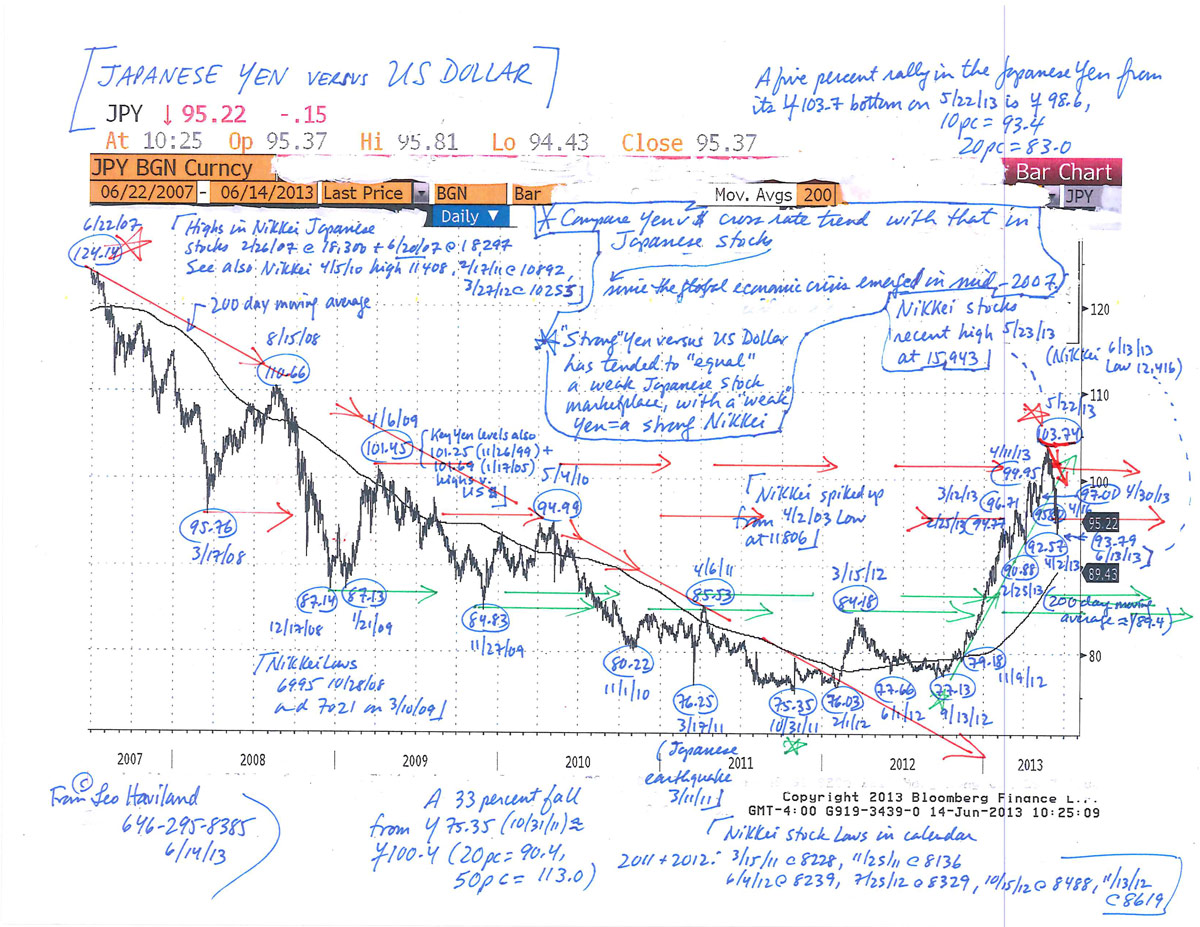
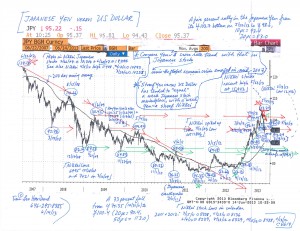
Japanese Yen versus US Dollar Chart (6-14-13)
The Federal Reserve Board proclaimed in June 2011 a framework of principles for an exit strategy from its extraordinary and highly accommodative monetary policy. Are their exit principles in the process of changing a little bit, and might they do so relatively soon? It seems so.
The Fed is not the only financial visionary with an exit strategy. Participants in debt, stock, currency, commodity, real estate, and other marketplaces also possess exit (and entrance) schemes and tactics.
What signs probably warn that (for whatever reason, including a potential change in Fed policy) there is a noteworthy (substantial) exit underway from long positions in the UST?
Those on the alert for bulls to exit (bears to enter) the UST corral should monitor German and Japanese sovereign debt marketplace yields. Also remember debt yields and trends for European “periphery” and emerging marketplace nations.
Of course US dollar, S+P 500, and commodity trends entangle with and help to explain exits from (and entrances into) UST (and other interest rate) playgrounds. How much convergence and divergence has there been and will there be between falling (and rising) UST yields and past and future S+P 500 patterns? If UST rates keep rising higher and higher (suppose they exceed the high achieved in the past few weeks), will the S+P 500 inevitably continue to move up and up? Other questions loom. If the Fed keeps repressing UST yields, what will the jury decide for the US dollar (either on a broad, real trade-weighted basis, or in individual crosses against the Euro FX, Japanese Yen, Chinese renminbi, and so forth).
Thus it apparently has become increasingly difficult (at least at low nominal yield levels) to captivate foreigners into buying UST notes and bonds (and T-bills too). The slowdown in overseas net buying of UST probably occurred after March 2013 as well. In this context, note the steady rise in rates since July 2012’s bottom (and the 1.55pc low on 11/16/12 and 1.56pc on 12/6/12). And after all, the US does have some inflation (now around 1.5 percent) and the first several years of the UST yield curve offers no (or very little) real return to foreigners or anyone else. The seven year note now yields around 1.60pc. Even the 10 year’s return is mediocre.
FOLLOW THE LINK BELOW to download this market essay as a PDF file.
Fed Up- Other Exit Strategies (6-10-13)
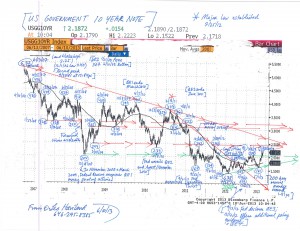
US Treasury 10 Year Note Chart (6-10-13)


 View Leo Haviland’s profile