GLOBAL ECONOMICS AND POLITICS
Leo Haviland provides clients with original, provocative, cutting-edge fundamental supply/demand and technical research on major financial marketplaces and trends. He also offers independent consulting and risk management advice.
Haviland’s expertise is macro. He focuses on the intertwining of equity, debt, currency, and commodity arenas, including the political players, regulatory approaches, social factors, and rhetoric that affect them. In a changing and dynamic global economy, Haviland’s mission remains constant – to give timely, value-added marketplace insights and foresights.
Leo Haviland has three decades of experience in the Wall Street trading environment. He has worked for Goldman Sachs, Sempra Energy Trading, and other institutions. In his research and sales career in stock, interest rate, foreign exchange, and commodity battlefields, he has dealt with numerous and diverse financial institutions and individuals. Haviland is a graduate of the University of Chicago (Phi Beta Kappa) and the Cornell Law School.
Subscribe to Leo Haviland’s BLOG to receive updates and new marketplace essays.

The long-running bull charge in the broad real trade-weighted United States dollar, and particularly its recent assault on major resistance established in March 2009, played a critical role not only in creating and sustaining emerging stock (and commodity) marketplace bear moves, but also in the recent bloody toppling of the once-mighty S+P 500 from its lofty May 2015 record peak. Interest rate levels and trends of course remain important to stock marketplace battlefields, but US dollar movements will maintain their substantial influence. The broad real trade-weighted dollar probably will remain relatively strong.
Moreover, the S+P 500’s decline since its 5/20/15 pinnacle at 2135 indicates that its major trend probably will no longer diverge as significantly from those of emerging equity marketplaces. Compare the pattern of the past few years, during which the S+P 500 exceeded its spring 2011 peak but emerging stock marketplaces in general (Morgan Stanley’s MSCI Emerging Stock Marketplace Index benchmark) did not. The S+P 500 probably will not surpass its May 2015 height by much (if at all); instead, it probably will continue to travel lower.
As “Shakin’ All Over: Marketplace Fears”; 8/13/15) noted: “Despite about seven years of highly accommodative monetary policies such as yield repression and money printing (and frequently bolstered by hefty deficit spending), the foundations of worldwide growth increasingly look shaky.” Substantial debt and leverage problems continue to confront today’s interconnected global economy. The Federal Reserve Board of course focuses on all sorts of domestic and international factors and their interrelations. However, nowadays the level and trend of the S+P 500 will continue to strongly influence its policy rhetoric and decisions.
****
What’s the bottom line? Reviewing these various US and diverse international stock marketplace scorecards together, spring 2015’s similar time for highs followed by significant price declines is noteworthy. This underlines the likely slowing of worldwide growth in general. It also shows that stock trend benchmarks for America are nowadays rather closely connected to those elsewhere, including emerging marketplaces. The similar timing of lows in August 2015 emphasizes that worldwide equities in general currently are “trading together”. Renewed roughly simultaneous retreats in emerging and advanced nation stock benchmarks would be an ominous sign to equity bulls and for world GDP growth rates.
FOLLOW THE LINK BELOW to download this article as a PDF file.
Wall Street Marketplace Violence (9-1-15)
Although China’s economy of course differs from those of other major nations around the globe, it intertwines with them. However, China’s huge debt securities marketplace receives relatively little attention from traders, analysts, and the media in comparison to those of the United States, the Euro Area, and Japan.
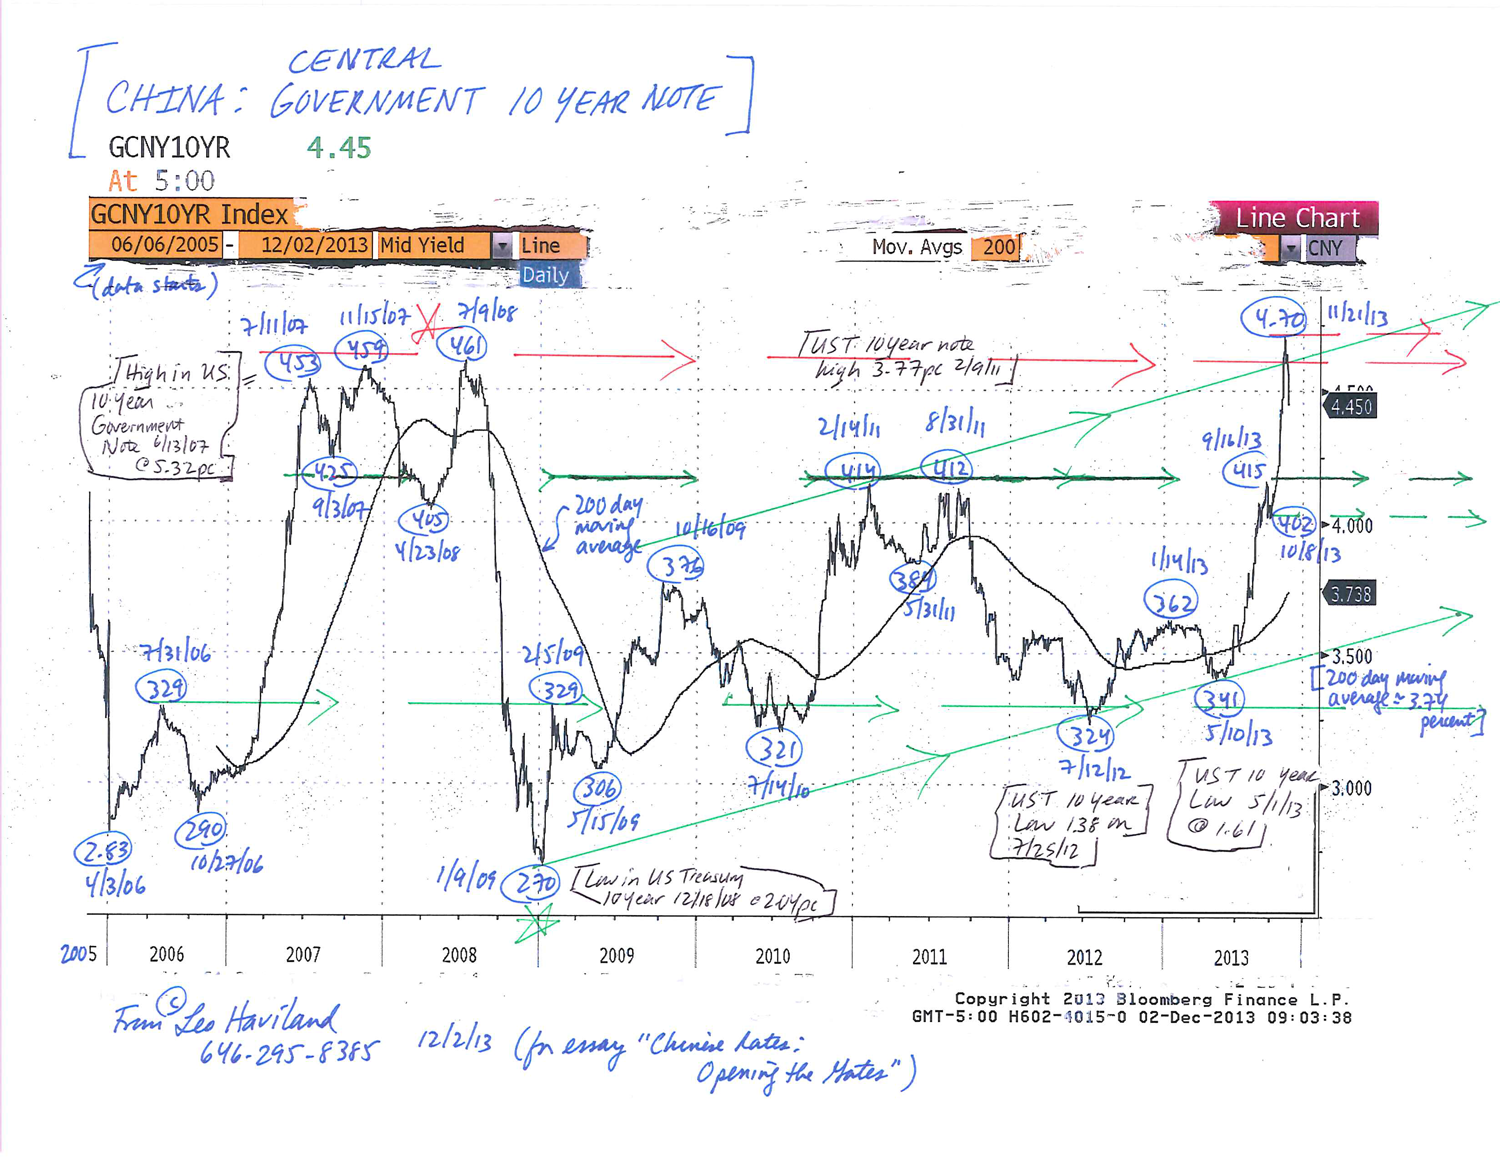
Debt, stock, currency, and commodity marketplace observers concentrating on matters such as Federal Reserve Board policy and the S+P 500’s level and trend should extend their vision to include Chinese interest rates. China’s 10 year government note, after establishing bottoms at 3.24 percent on 7/12/12 and 3.41pc on 5/10/13, has raced higher. After a brief stop at 4.02pc on 10/8/13, the note decisively crashed through 2011’s 4.10pc barrier, recently breaking through 2007-08’s wall around 4.60pc to reach its recent high of 4.70pc on 11/21/13. The one year government note yield likewise has ascended significantly. Chinese government interest rates probably will continue to climb higher.
Near-universal optimism reigns regarding China’s economic situation and prospects. Even if the national economy is relatively robust, it may be less so than many believe.
Given China’s obvious importance to the world economy, a greater than expected slowdown in the marvelous Chinese growth rate, in part due to sustained higher yields, probably would entangle with and undermine recovery prospects in other territories. Moreover, since the end of the joyous Goldilocks Era and during the dreadful international economic crisis and the subsequent recovery, many turning points in the 10 year Chinese government note have occurred around the same time as those in benchmark 10 year US Treasury and German government notes. Thus despite the yield repression policy tightly embraced by the Federal Reserve and its central banking allies, the notable ascent in Chinese government interest rate yields underlines that the overall long run trend for yields in most key nations is probably higher.
FOLLOW THE LINK BELOW to download this market essay as a PDF file.
Chinese Rates- Opening the Gates (12-2-13)
Chart- Chinese Government 10 Year Note (for essay, Chinese Rates- Opening the Gates) (12-2-13)
For several years, in response to the terrifying ongoing international economic crisis, the Federal Reserve Board, European Central Bank, and many other key central banks have played Santa Claus to the global economy in general and debtors (borrowers) in particular. Suppose marketplace stargazers scan the constellation of accommodative Fed policies. These include the blessings of ground level interest rates (Federal Funds) and three sparkling rounds of money printing. The Fed joyously promises to continue offering its bountiful gifts for quite some time!
Not to be outdone, American and other politicians chattering and sometimes laboring in their workshops, engage in massive deficit spending designed to launch and preserve economic recovery.
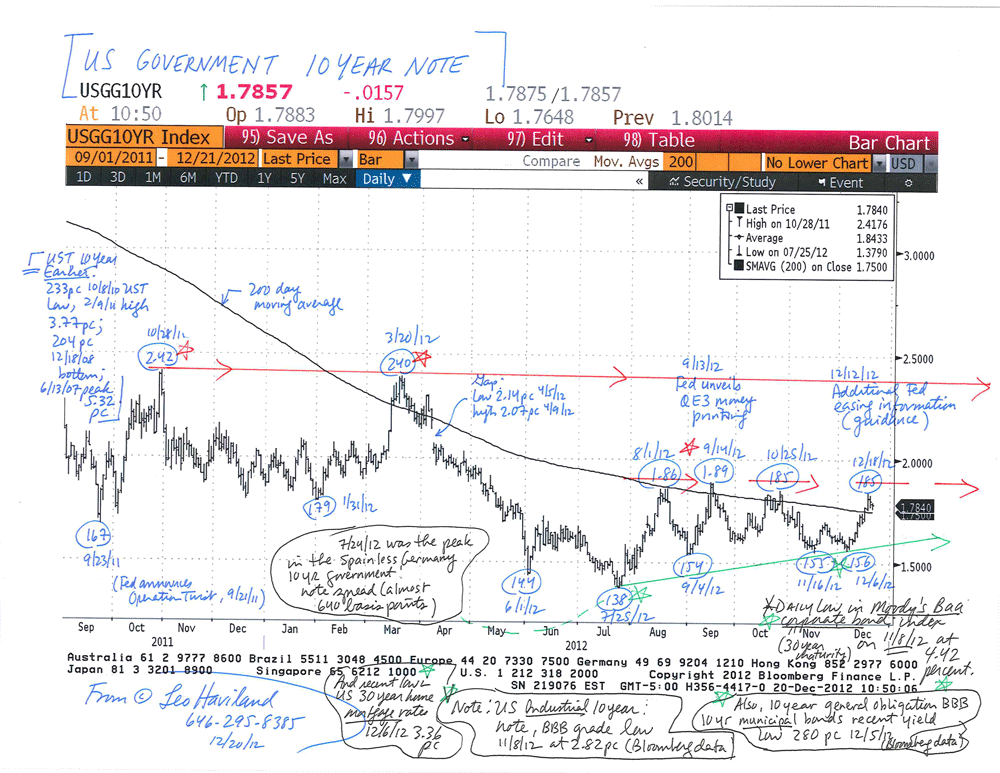
In any event, the UST 10 year note established a major bottom several months ago, at 1.38 percent on 7/25/12. Note that on 12/12/12 the beneficent Federal Reserve not only reaffirmed its two percent long run inflation target, but also indicated it would tolerate inflation projections of 2.5pc for up to two years ahead. Ascending UST rates suggest that the US corporate realm likewise in general will have higher rates.
Take Moody’s Baa index of bonds as a benchmark for US lower quality corporate bonds, yet nevertheless “investment grade”.
Based upon this Baa corporate signpost, US lower quality corporate bond rates have been creeping up lately. They probably established a very significant trough around 4.5 percent in November 2012, or will do so soon. Using daily data (and the extra decimal point) that bottom was 4.42 percent on 11/8/12 (12/18/12 close 4.76pc).
In the US credit arena nowadays, a widening yield spread between lower quality corporate debt and UST might reflect that the hunt for better yields beyond the UST field probably has reached an end.
FOLLOW THE LINK BELOW to download this market essay as a PDF file.
American Yield Quests- US Treasury and Corporate Rates (12-20-12)
US Treasury 10 Year Note Chart (12-20-12)


 View Leo Haviland’s profile