GLOBAL ECONOMICS AND POLITICS

Leo Haviland provides clients with original, provocative, cutting-edge fundamental supply/demand and technical research on major financial marketplaces and trends. He also offers independent consulting and risk management advice.

Haviland’s expertise is macro. He focuses on the intertwining of equity, debt, currency, and commodity arenas, including the political players, regulatory approaches, social factors, and rhetoric that affect them. In a changing and dynamic global economy, Haviland’s mission remains constant – to give timely, value-added marketplace insights and foresights.

Leo Haviland has three decades of experience in the Wall Street trading environment. He has worked for Goldman Sachs, Sempra Energy Trading, and other institutions. In his research and sales career in stock, interest rate, foreign exchange, and commodity battlefields, he has dealt with numerous and diverse financial institutions and individuals. Haviland is a graduate of the University of Chicago (Phi Beta Kappa) and the Cornell Law School.


Subscribe to Leo Haviland’s BLOG to receive updates and new marketplace essays.

RSS View Leo Haviland's LinkedIn profile View Leo Haviland’s profile


SHAKIN’ ALL OVER: MARKETPLACE CONVERGENCE AND DIVERGENCE © Leo Haviland June 18, 2018

OVERVIEW AND CONCLUSION

Financial wizards not only offer competing opinions regarding past, current, and future trends for stock, interest rate, currency, and commodity marketplaces. Their rhetoric displays diverse viewpoints regarding alleged relationships within and between those categories. For example, within the global stock constellation, various apostles elect to compare the travels of the S+P 500 with those of the Nasdaq Composite or with an emerging marketplace stock benchmark. Alternatively, some visionaries herald their subjective insights and foresights about connections between stocks (such as the S+P 500) and interest rates (such as the United States 10 year government note), perhaps also including the US dollar and the commodities galaxy in their investigations.

Luminaries tell stories offering their cultural perspective regarding apparent convergence and divergence (lead/lag) relationships within and between marketplace domains. Viewpoints regarding convergence and divergence encompass not only price direction (trend), but also the timing (start and end date; duration) of a given move as well as the distance it travelled. In any case, these links (associations; patterns) can alter, sometimes substantially and occasionally permanently. Marketplace history, including that related to convergence and divergence, is not marketplace destiny, whether entirely or even partly.

****

History reveals that the S+P 500 and emerging marketplace stocks “in general” (MSCI Emerging Stock Markets Index, from Morgan Stanley; “MXEF”) often have had very important trend changes in the same direction “around” the same time.

After establishing important bottoms together in first quarter 2016, the key American stock indices and those of other important advanced nations and the “overall” emerging stock marketplace traded closely together from the directional and marketplace timing perspective. Though the bull moves since first quarter 2016 in these assorted domains did not all voyage the same distance, all were very substantial. Their rallies since around the time of the November 2016 United States Presidential election were impressive. Both emerging marketplace equities and the S+P 500 established important peaks in first quarter 2018 (MXEF 1279 on 1/29/18; S+P 500 2873 on 1/26/18).

Yet whereas since its first quarter 2018 summit prices for the emerging stock marketplace arena have eroded significantly and currently rest at their calendar 2018 lows, the S+P 500 has retraced much of its dive and now (6/15/18 close 2780; stock price data in this essay is through 6/15/18) stands only slightly over three percent from its 1Q18 top. This divergence, though not massive, is noteworthy. A similar but more extreme divergence between these stock benchmarks existed from spring 2011 (and note particularly since around second half 2014) through about May 2015. The S+P 500 kept going up and achieved new highs over its spring 2011 one, but the MXEF failed to do so.

After spring 2015, convergence developed, with a bear trend in the S+P 500 accompanying the existing downhill one in the emerging marketplace stock group. An important factor assisting this was the decisive climb in the broad real trade-weighted United States dollar (“TWD”) above its critical resistance around 96.6. A similar convergence is likely to occur in the present MXEF and S+P 500 marketplace relationship, with the significant divergence disappearing and both equity realms falling “together”.

US corporate earnings indeed have been quite strong, with share buybacks and mergers and acquisitions robust. Nevertheless, one bearish factor for stocks in the current landscape is the broad real trade-weighted dollar’s recent advance over the 96.2/96.6 barrier (compare 2015); also recall the TWD rally beginning in spring 2008 during the 2007-09 global economic disaster). The ascending US yield trend (which began in July 2016, accelerating in 1Q18) has encouraged the TWD’s modest rally in the past few months. Trade war talk and potential tariffs probably have assisted the TWD’s appreciation. The US is a net importer nation; some exporters (which include many developing nations) may depreciate their currency to maintain market share within the US.

Another bearish sign for both advanced nation and emerging marketplace stocks is the persistent climb in US Treasury yields. Rising global yields alongside a strengthening dollar is especially painful to emerging marketplace countries and thus their stock marketplaces. Many developing nations, including their corporations, have dollar-denominated debt. And underscore in this context another point: for America over the past century, sustained rising yields generally have led to American stock marketplace declines. Given the Federal Reserve Board’s ongoing tightening policy (and its normalizing balance sheet, as well as probable willingness to allow some overshooting of its two percent inflation target), growing substantial US federal deficits (aided by tax “reform” legislation enacted in December 2017), substantial US household credit demand, a low unemployment rate, and other factors, US government yields probably will tend to keep rising over the long run. The growing mountain of US public debt, including as a percentage of GDP, also tends to push up interest rates.

A confirming sign for equity feebleness in both the S+P 500 and the MXEF likely will be weakness in commodities prices. Commodities often have peaked (bottomed) around the same time as a crucial top (bottom) in important advanced nation or emerging marketplace stocks. However, there have sometimes been lags. Recall that in during the worldwide financial crisis following the glorious Goldilocks Era, commodities “in general” peaked after the S+P 500 and emerging marketplace stocks. The broad Goldman Sachs Commodity Index (“GSCI”) has declined since 5/22/18’s 498 high.

FOLLOW THE LINK BELOW to download this article as a PDF file.
Shakin' All Over- Marketplace Convergence and Divergence (6-18-18)

GLOBAL STOCK MARKETPLACES: WINTER OF DISCONTENT © Leo Haviland March 5, 2018

“I’m goin’ down the road feelin’ bad
I don’t want to be treated this-a-way.” Bill Monroe, the Grateful Dead, and other musicians have performed versions of the traditional song, “Goin’ Down the Road Feelin’ Bad”

****

OVERVIEW AND CONCLUSION

American stock indices “in general” inspire an assortment of stories regarding them, including reasons for their past, present, and future levels and trends. Many of these descriptions and analyses regarding broad benchmarks such as the S+P 500 and Dow Jones Industrial Average appear relatively unique to the United States. However, economic regions and financial marketplaces around the world have increasingly intertwined during the course of globalization in recent decades, and especially during the past several years.

Therefore the directional travels (bull and bear adventures) of America’s stock marketplace increasingly have tended to parallel those of other significant advanced countries and regions. In recent years, the trends of emerging marketplace stocks “in general” increasingly have interconnected with those of leading advanced nations. Consequently, narratives and explanations regarding a broad “national” stock marketplace indicator such as the S+P 500 often involve those of equity barometers elsewhere (as well as interest rate, currency, and commodity movements).

****

History underscores that across the fields of these various stock marketplace signposts, the timing of key price turns and the duration and extent (percentage distance travelled) of very important trend moves are not always exactly the same or extremely close. But they often are.

****

After establishing important bottoms together in first quarter 2016 (and during the preceding price decline), the key American stock indices and those of other important advanced nations and the “overall” emerging stock marketplace have traded closely together from the directional and marketplace timing perspective. Though the bull moves since first quarter 2016 in these assorted domains did not all cover the same distance, all were very substantial. Their rallies since around the time of the November 2016 United States Presidential election were impressive. Investors and other stock owners, Wall Street, and the financial media cheered the majestic ascent. Heated advice to “buy the dip” became widespread as the S+P 500 climbed and as price declines tended to become less substantial in percentage terms.

However, the glorious bull move in American and other related stock marketplace halted in first quarter 2018. A mournful “correction”, a decline of roughly ten percent, ensued. The disturbing decline in the S+P 500 and other significant global stock marketplace indices probably will continue. However, if the S+P 500 and other equity benchmarks manage to surpass their January 2018 highs, they probably will not do so by much.

****

For further economic and political analysis, see “There Will Be Blood: Financial Battlefields” (2/9/18), “Busload of Faith: Financial Marketplaces” (1/15/18), “Marketplace Vehicles: Going Mobile” (12/13/17), “History on Stage: Marketplace Scenes” (8/9/17), and other essays.

FOLLOW THE LINK BELOW to download this article as a PDF file.
Global Stock Marketplaces- Winter of Discontent (3-5-18)

STOCK MARKETPLACES: AT THE CROSSROADS © Leo Haviland, September 4, 2017

“Money beats soul, every time.” “Roadhouse Blues”, by The Doors, with John Lee Hooker

****

CONCLUSION AND OVERVIEW

Many observers (including stock owners) are complacent about prospects for the emergence of significant stock marketplace declines, particularly in regard to the United States stock arena. Even a ten percent drop in US equities would shock many audiences. The S+P 500 and related American benchmarks nevertheless have been in the process of establishing an important top. The glorious long run bull advance in American stocks which started with the S+P 500’s major bottom at 667 on 3/6/09 probably is at or near its end. The S+P 500’s record height to date is 8/8//17’s 2491. That S+P 500 elevation probably will not be exceeded by much, if at all.

American stocks “in general”, although not an isolated island, have their own “individual” stories, as do assorted other stock marketplaces, whether in relation to earnings, valuations, or other phenomena. Yet marketplace history in recent years suggests that prices of stock marketplace signposts for other advanced (developed) nations and for emerging marketplaces “in general” likely will accompany any notable downtrend (including a bear move) in US equities.

****

Admittedly, since first quarter 2016, and especially after around America’s November 2016 Presidential election, emerging stock marketplaces generally have rallied alongside the S+P 500 and its domestic comrades such as the Dow Jones Industrial Average, Nasdaq Composite, and Wilshire 5000. But the MSCI Emerging Stock Markets Index, from Morgan Stanley (“MXEF”), a guide for emerging stock marketplaces, is around major resistance and (unlike the S+P 500) well below all-time highs.

Owners of (particularly “investors”) American and international equities hopeful of enjoying further upward rides should note other significant yellow warning lights. In mid-year 2017, leading European and Japanese stock marketplaces established highs. The S+P 500’s 6/19/17 interim top at 2454 occurred around the time of these highs. However, these European and Japanese mid-2017 stock tops have not been broken. And the S+P 500’s August 2017 high exceeds its June 2017 one by only 1.5 percent.

But after their dreary troughs in first quarter 2016, didn’t Germany’s DAX and the United Kingdom’s FTSE exceed their spring 2015 plateaus, as did the S+P 500 (5/20/15 high 2135). Yes, but the April 2015 summit for a broader measure for European stock performance, the STOXX Europe 600 Index (“SXXP”), remains intact. Japan’s June 2015 Nikkei height likewise remains a roadblock.

The adventures of Canada’s S+P/Toronto Stock Exchange Composite Index (“SPTSX”) are also a bearish sign to worldwide stock marketplaces. It has failed to vault over its February 2017 top (established prior to the mid-2017 ones in Europe and Japan). Also, February 2017’s SPTSX plateau edged only 1.6 percent above its September 2014 pinnacle.

FOLLOW THE LINK BELOW to download this article as a PDF file.
Stock Marketplaces- at the Crossroads (9-4-17)

EUROZONE: RUNNING IN CIRCLES © Leo Haviland November 18, 2013

Nevertheless, although the Euro Area “in general” is not entirely out of gas and running on empty, it is running in place. Its economic performance for the next few years probably will be sluggish. There will be little or no economic growth, general government debt will remain quite high, and unemployment will stay very lofty.

The Eurozone economy is going nowhere fast on the road to recovery. Of course differences between individual nations exist; Germany is not Greece.

For the stock arena, take the SXXP index of 600 European stocks (though it includes United Kingdom and other non-Euro Area companies) as a benchmark (Bloomberg symbol is SXXP). This vehicle, like America’s S+P 500, has not moved in a sideways pattern, but instead has (despite some sharp twists and turns) flown sky-high since its 3/9/09 major low at 155.4 (S+P 500 major trough 3/6/09 at 667). The bottom line is that the probable path of European equities probably is closely bound with that of American stocks.

With the SXXP now around 325.0, what’s the rundown on some SXXP levels to monitor? Recall 332.9, the 5/19/08 high. The final top in the S+P 500, after its 10/11/07 pinnacle at 1576, also occurred 5/19/08 (at 1440). If prices fall from current levels, note that twice the 3/9/09 bottom is 310.8; keep an eye on 2/18/11’s 292.2 if prices stumble further. Unlike the S+P 500, the SXXP has not escaped above its 2007 peaks. Are prices for European equities circling back to their former record heights? In any event, if European stock prices venture even higher from current levels, watch 10/11/07’s summit at 391.3 and the major pinnacle of 401.0 on 7/13/07.
11-18

FOLLOW THE LINK BELOW to download this market essay as a PDF file.
Eurozone- Running in Circles (11-18-13)
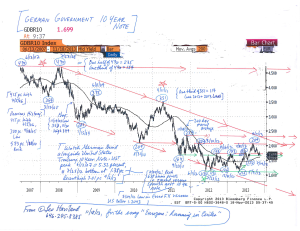
Chart- German Govt 10 Year Note (for essay, Eurozone- Running in Circles) (11-18-13)