

GLOBAL ECONOMICS AND POLITICS

Leo Haviland provides clients with original, provocative, cutting-edge fundamental supply/demand and technical research on major financial marketplaces and trends. He also offers independent consulting and risk management advice.

Haviland’s expertise is macro. He focuses on the intertwining of equity, debt, currency, and commodity arenas, including the political players, regulatory approaches, social factors, and rhetoric that affect them. In a changing and dynamic global economy, Haviland’s mission remains constant – to give timely, value-added marketplace insights and foresights.

Leo Haviland has three decades of experience in the Wall Street trading environment. He has worked for Goldman Sachs, Sempra Energy Trading, and other institutions. In his research and sales career in stock, interest rate, foreign exchange, and commodity battlefields, he has dealt with numerous and diverse financial institutions and individuals. Haviland is a graduate of the University of Chicago (Phi Beta Kappa) and the Cornell Law School.


Subscribe to Leo Haviland’s BLOG to receive updates and new marketplace essays.

RSS View Leo Haviland's LinkedIn profile View Leo Haviland’s profile



SPRINGING A QUESTION: ARE EMERGING STOCK MARKETPLACES IN BLOOM? © Leo Haviland April 9, 2013

Many wizards praise emerging marketplace countries such as China as engines for international prosperity. The worldwide scope of the 2007 financial (economic) crisis and the following years emphasizes the close interconnection of the economies of advanced nations and key emerging (developing) countries around the globe. Historical review from the dawn of the global economic disaster up to the current time reveals price and time parallels between the trends of emerging stock marketplaces and those of the US (and related stock arenas in Europe and other advanced nations). Therefore, the bear trend since spring 2011 in emerging marketplaces is a warning sign to the S+P 500.

Maybe emerging stock marketplaces will resume their bull trend alongside a continuing climb by the S+P 500. However, the downturn within this flock of emerging countries is widespread. Note also the similar fall in commodity prices in general. Such considerations indicate that a return to the bull side by stock marketplaces of emerging marketplaces in general is unlikely. Although relative to their dismal appearance of autumn2008/winter2009, emerging marketplaces may seem to be in full flower (“still looking pretty good”), their bloom has faded substantially and suggests potential for further withering. Not only have stock benchmarks of developing nations in general been a bear trend, but also they established additional interim tops in early 2013. This underlines the significant potential for a notable decline in the S+P 500 in the relatively near future.

Chart--Emerging-Stock-Marketplaces-(4-9-13)

FOLLOW THE LINK BELOW to download this market essay as a PDF file.
Chart- Emerging Stock Marketplaces (4-9-13)
Springing a Question- Are Emerging Stock Marketplaces in Bloom (4-9-13)
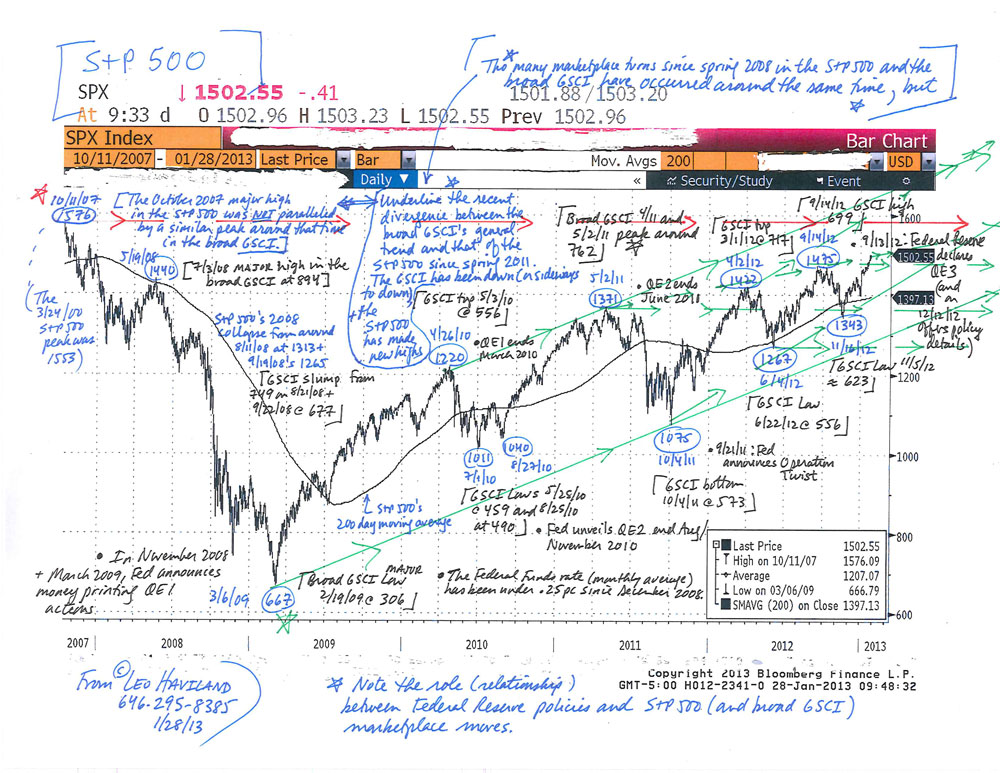
COMMODITIES AND US STOCKS: CONVERGENCE AND DIVERGENCE © Leo Haviland January 28, 2013

Since mid-2008, commodities “in general” and United States stocks “as a whole” have moved roughly in the same direction at around the same time. In this convergence process (relationship), noteworthy bull (bear) moves in US equities find parallels in those in the commodity arena. Thus significant marketplace rallies (declines) have tended to occur around the same time.

However, this perspective is not the only vantage point by which to assess the often close relationship between US equities and the commodities complex. There also is another, longer run view by which one can examine the relationship between them. Since spring 2011, commodities have ventured down (or sideways to down). However, key American stock benchmarks such as the S+P 500 have attained new highs, first in April 2012, then September 2012, and again in January 2013. Thus despite the convergence at assorted timely turning points since spring/ summer 2008, and even though the two territories continue to trade together to some extent, arguably there has been noteworthy divergence in their overall relationships (their trends) since May 2011.

Now recall several of 2007-08’s details. US equities peaked in October 2007, almost nine months before the commodity one in early summer 2008. Only after the final stock marketplace

summit in May 2008 did equities and commodities trade in close tandem. The current longer run relationship thus perhaps likewise reveals divergence, but with the commodity peak to date appearing well before any major S+P 500 one.

In contrast to 2007-08, what if the major peak in commodities is well before that in stocks (and the lag is likewise so great as to suggest divergence)? Suppose- and this admittedly is a key suppose- eventually commodities and US stocks will trade together over the long run. After all, so-called marketplace relationships can change dramatically, whether from the convergence/ divergence (lead/lag) perspective or otherwise. What does continued divergence, the failure of commodities to near or exceed its spring 2011 heights, suggest?

The 2007-08 relationship warns that the current continued failure of commodities to confirm the equity rally eventually will reveal a notable decline in stocks. Since the duration between the spring 2011 commodities top and today’s new highs in the S+P 500 is almost 20 months, whereas that between October 2007’s stock pinnacle and the broad GSCI’s summit in July 2008 was about nine months, the failure of the broad GSCI to achieve new heights should warn equity bulls that a decline may be fairly near in time.

S+P-500-Chart-(1-28-13,-for-essay-on-Commodities-and-US-Stocks)

FOLLOW THE LINK BELOW to download this market essay as a PDF file.
Commodities and US Stocks- Convergence and Divergence (1-28-13)
S+P 500 Chart (1-28-13, for essay on Commodities and US Stocks)

STOCK AND COMMODITY CROSSROADS © Leo Haviland June 12, 2012

In diverse ways, many financial marketplace pilgrims monitor the equity realm and the commodities universe “together”. In recent years, significant price trends in commodities “in general” (use the broad Goldman Sachs Commodity Index as a signpost) roughly have paralleled those of the S+P 500. Noteworthy bull voyages in the GSCI have commenced at “around” the same time as those in the S+P 500. The same perspective appears for bear trips. Intersections between equity benchmarks and commodities contribute to the ongoing worldwide economic crisis story.

Some narrower stock sector indices such as the XOI, OSX, CRX, XNG, and XLE stand at a crossroads between commodities related to them and to wider equity indicators like the S+P 500. Thus many narrow equity domains intersect with (have links to) the so-called overall United States (and global) economy as well as to the important commodities related to that given sector. Thus an equity index composed of corporations involved in the petroleum industry reflects to some extent price levels and trends in “underlying” (related) oil prices. Thus some narrow United States stock sector indices at times can offer useful perspectives on (confirm, reflect) past, current, and future paths for wider stock indices such as the S+P 500 and the broad GSCI.

Scan the attached chart analysis. The broad GSCI chart displays price and time links between commodities and the S+P 500 from mid-2008 (and the acceleration of the worldwide economic disaster) through the recovery and up to the present. See several important equity sector indices, the XOI, OSX, XNG, and CRX, in this context. These four narrow equity indicators contain different members. Their price and time routes are not exact duplicates. Yet significantly, especially when interpreted together, the patterns of the XOI and its friends resemble that of the S+P 500 and the broad GSCI.

This viewpoint does more than underline that the international economic crisis that walked onstage in 2007 remains far from solved. Take a look at the price level from the start of May 2012 to now in these stock and commodity charts alongside their prices during mid to late summer 2008. The 5/1/12 and thereafter levels are around ranges from which prices collapsed as the economic disaster worsened in late 2008. The world of course is not exactly the same now as then. Many observers contend that central bankers, finance ministers, and politicians have gained experience as the global economic crisis has unfolded.

Nevertheless, though stock and commodity marketplaces in 2012 or thereafter may not repeat the accelerated descent of late 2008, that period of four years ago should not be forgotten. Keep the attached chart of the S+P 500 from the sunset of the blissful Goldilocks Era in 2007 to the marketplace bottom on 3/6/09 at 667 in mind.

FOLLOW THE LINK BELOW to download this market essay as a PDF file.
Stock and Commodity Crossroads (6-12-12)
Stock and Commodity Crossroads- Charts (6-12-12)

THE WORLDWIDE ECONOMIC GROWTH STORY: CHINESE AND INDIAN STOCKS ALONGSIDE COMMODITIES © Leo Haviland, April 2, 2012

Lows in the Chinese and Indian stock marketplaces in late October 2008 preceded the S+P 500’s major bottom on 3/6/09 at 667. Yet the final lows in China’s stocks, as in India’s, occurred in early March 2009 alongside the S+P 500.

The US stock marketplace (S+P 500 benchmark) continues to advance toward its crucial “final peak” during the worldwide economic crisis, 5/19/08 at 1440 (10/11/07 pinnacle 1576). To many players, the still fairly recent S+P 500 low on 10/4/11 at 1075 perhaps seems a relic of a distant dismal past.

But not only are China’s stocks (Shanghai Composite) far below (around sixty-three percent) their 10/16/07 plateau at 6124. India’s (Sensex) remains rather distant (about 17.6pc) from its 1/10/08 top just over 21200.  Despite the bull move in US equities, the Chinese and Indian stock playgrounds have continued within downtrends that began in November 2010/ April 2011 (or even earlier, in the case of China). Admittedly, China’s and India’s equity marketplaces may not reflect their so-called overall economies. But these sustained equity downtrends do fit the cuts by many gurus in growth forecasts for these two national economies.

Given the importance of China and India to the worldwide economic growth story, these Chinese and Indian bear stock trends should make one ask how strong the overall world economy really is.  US stocks and overseas ones need not travel in the same direction. Observers still should wonder which near term trend will prevail over time (going forward), the bull one in US stocks, or the bear one in China/India.

However, many commodity groups (at various times) in 2011 began bear trends. Despite differences between the various commodity sectors, this rough overall commodity pattern tends to fit the bear trend story expressed via Chinese and Indian stock patterns.  The broad Goldman Sachs Commodity Index peaked at 762 on both 4/11/11 and 5/2/11. Is the petroleum complex an exception to trends in base metals, steel, iron ore, steam coal, silver, agriculture in general, and even gold? Perhaps. There is obviously a risk of an Iranian event. Brent made a new high on 3/1/12 at 128.4, just above its April 2011 summits around 127.0. Yet NYMEX crude and US Gulf Coast gasoline and diesel fuel prices remain below their spring 2011 heights. Current overall petroleum industry inventories in advanced nations are at above average levels in days coverage terms, though a move to just-in-case inventory management probably has tightened oil stocks.

Maybe the money printing/low government interest rates/deficit spending by the US and many other nations will continue to rally some equity marketplaces (like America’s, especially given its very low Treasury yields) and bolster many commodities.  However, the bearish commodity trends that commenced in 2011, when interpreted alongside Chinese and Indian stock trends, nevertheless warn of slowing international growth and that a bear trend in US stocks may commence fairly soon. A popular refrain: “strong stocks (S+P 500) equals strong commodities, weak stocks equals weak commodities”. The stock aspect of this refrain probably should be widened to include members in addition to the S+P 500 and related “advanced” (OECD) nations.

In any event, despite the rally in the S+P 500, trends in the Chinese and Indian stock marketplaces warn that the worldwide economic crisis probably is not close to being solved.

FOLLOW THE LINK BELOW to download this market essay as a PDF file.
Worldwide Economic Growth Story- Chinese and Indian Stocks Alongside Commodities (4-2-12)

Chinese and Indian Stocks Alongside Commodities (4-2-12)