GLOBAL ECONOMICS AND POLITICS
Leo Haviland provides clients with original, provocative, cutting-edge fundamental supply/demand and technical research on major financial marketplaces and trends. He also offers independent consulting and risk management advice.
Haviland’s expertise is macro. He focuses on the intertwining of equity, debt, currency, and commodity arenas, including the political players, regulatory approaches, social factors, and rhetoric that affect them. In a changing and dynamic global economy, Haviland’s mission remains constant – to give timely, value-added marketplace insights and foresights.
Leo Haviland has three decades of experience in the Wall Street trading environment. He has worked for Goldman Sachs, Sempra Energy Trading, and other institutions. In his research and sales career in stock, interest rate, foreign exchange, and commodity battlefields, he has dealt with numerous and diverse financial institutions and individuals. Haviland is a graduate of the University of Chicago (Phi Beta Kappa) and the Cornell Law School.
Subscribe to Leo Haviland’s BLOG to receive updates and new marketplace essays.

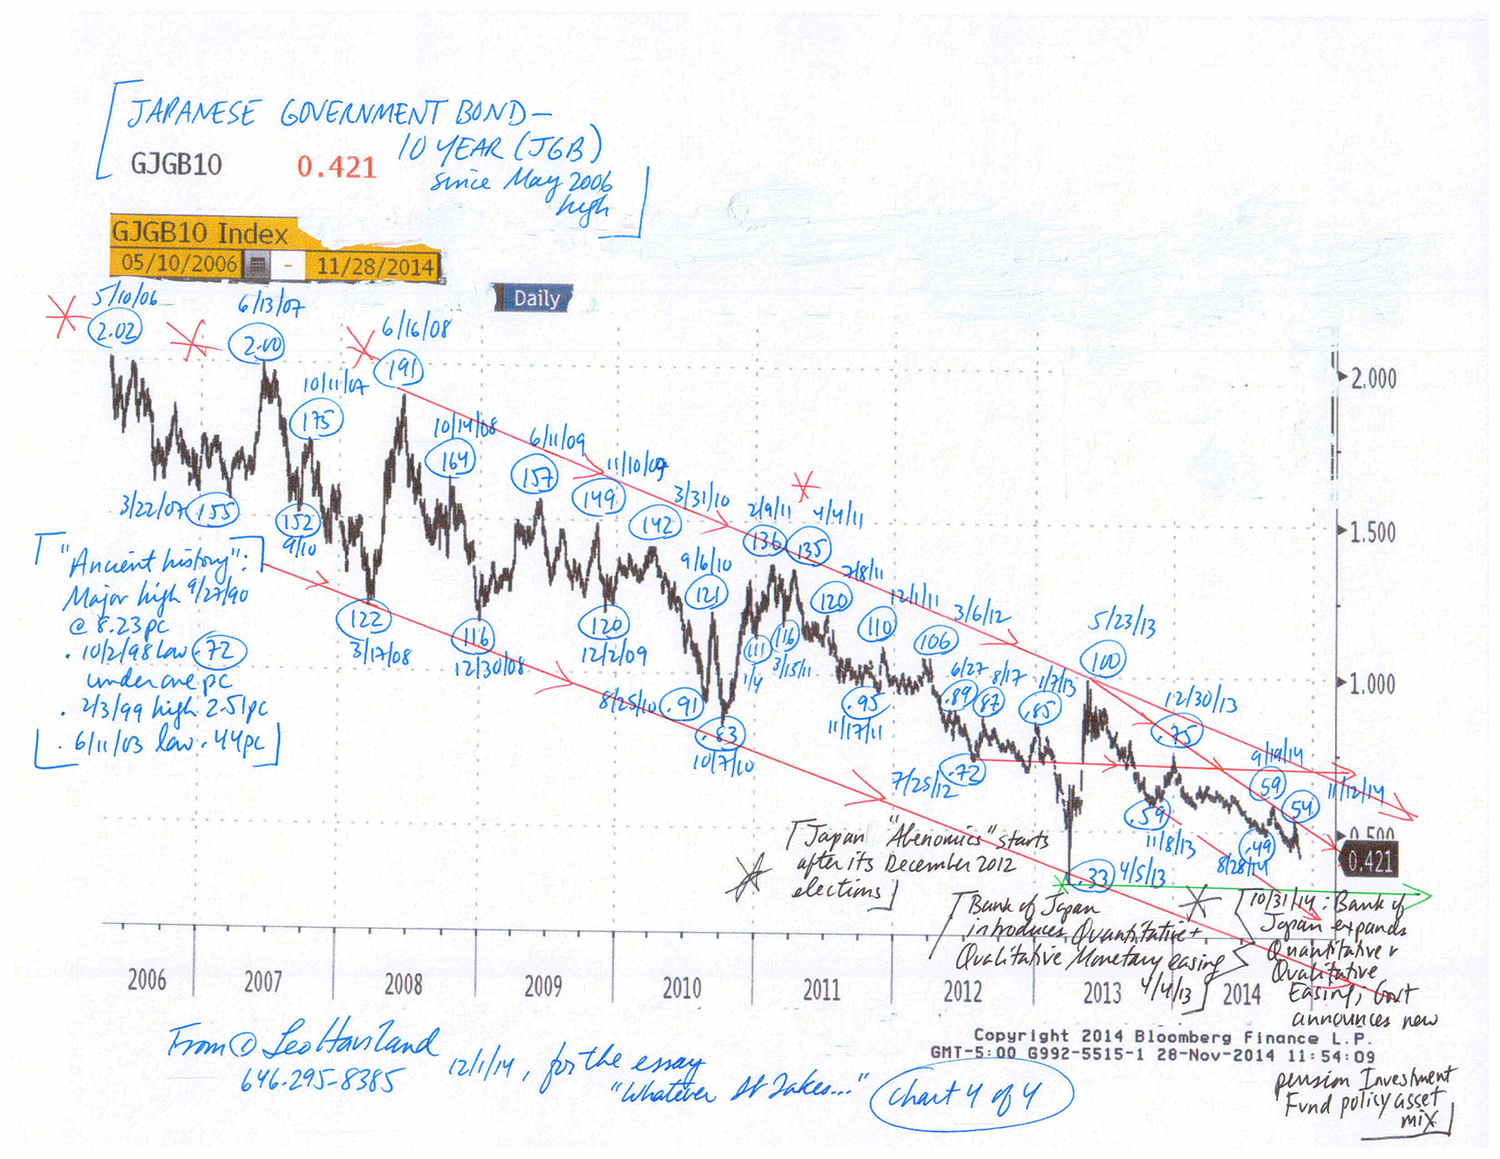
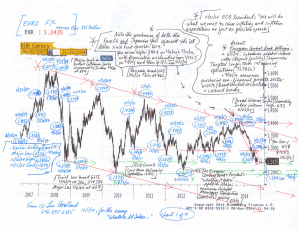
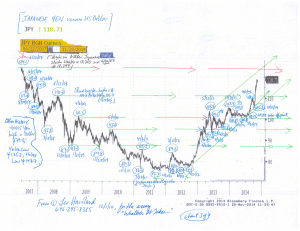
The Euro FX and Japanese Yen for several months have been weakening together, both against the US dollar and on an effective exchange rate basis. This currency relationship and bear trend will continue. Despite the Eurozone’s and Japan’s brave quests to create sufficient inflation (escape deflation), their success probably will be limited; inflation and longer term government interest rates probably will not sustain significant increases. However, even if substantial currency depreciation and massive money printing manage to achieve an inflation goal (and higher interest rates), they likely will not generate sustained economic growth.
Given that both the Eurozone and Japan suffer from low growth and deflationary challenges and fears, is weakness in the Euro FX connected with (encouraging that of) the Japanese Yen? Is the Yen’s swoon helping to depreciate the Euro FX? Are Japan and the Eurozone (and other nations) engaged in competitive devaluations (currency wars) to bolster growth?
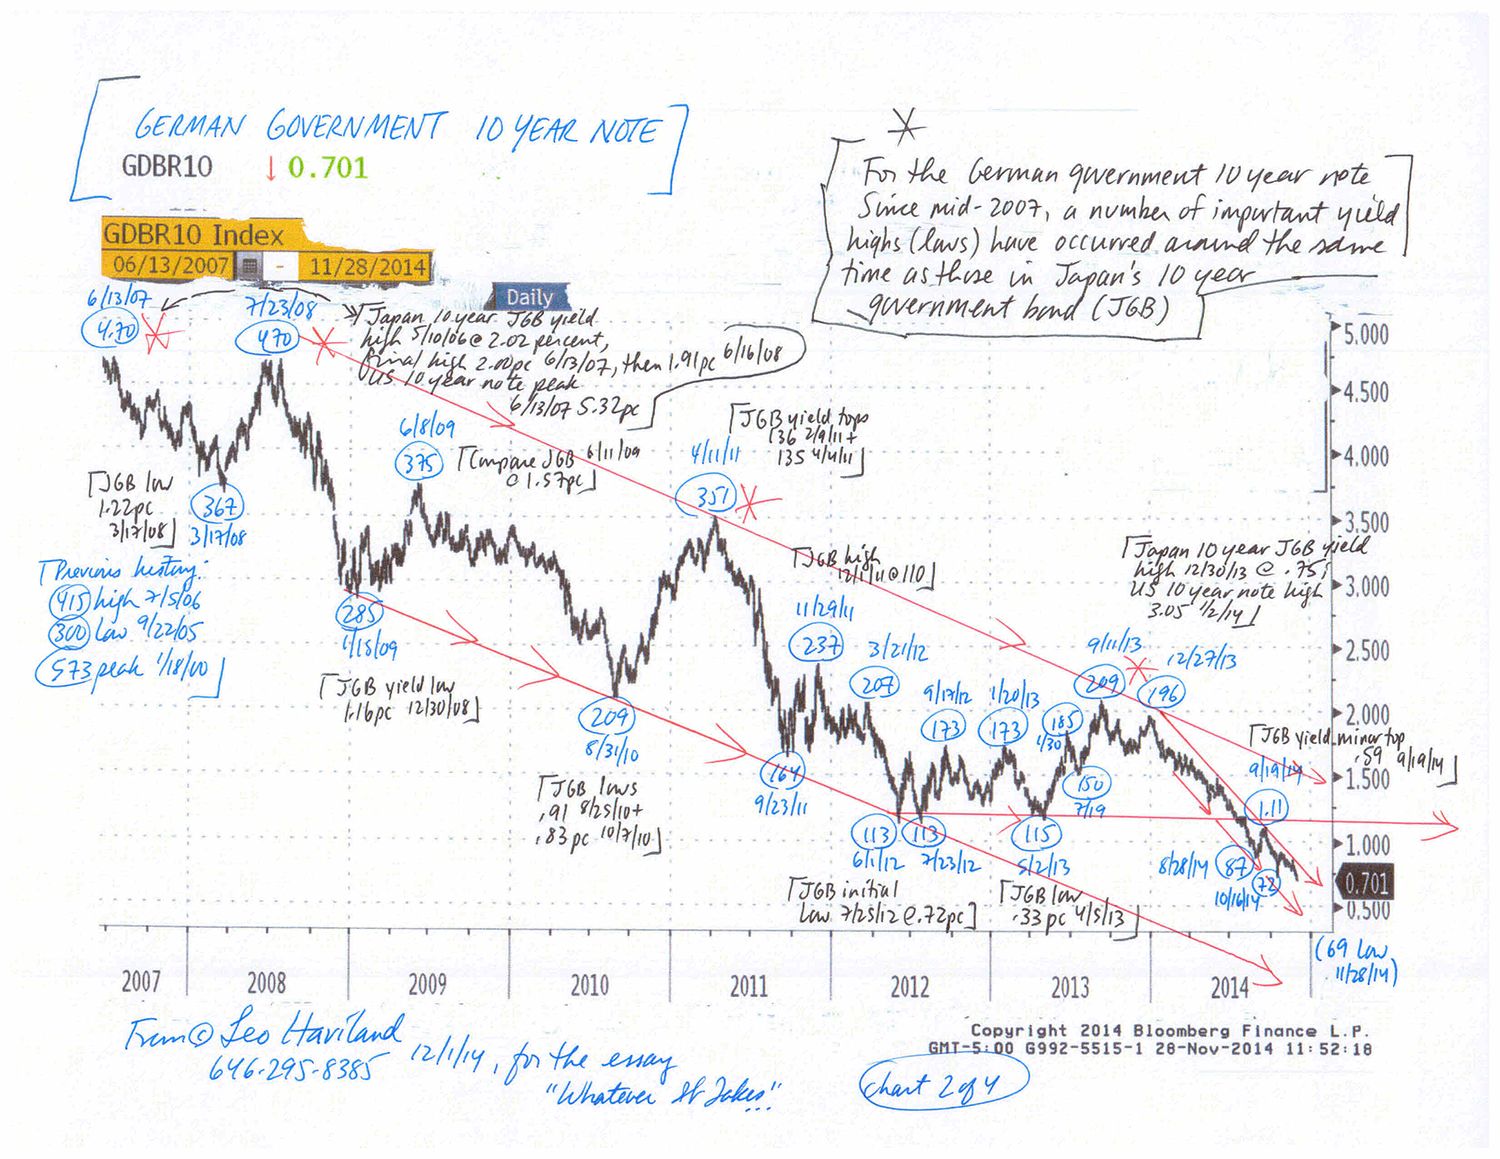
One sign of the obstacles facing the Eurozone and Japan in their quest to boost inflation (and generate higher interest rates) is the recent behavior of the UST 10 year government note. American GDP recently has been robust, rising at an annual rate of 4.6 percent in 2Q14 and 3.9pc in 3Q14. However, the UST 10 year yield around 2.20pc remains well beneath its 1/2/14 top at 3.05pc. Admittedly the UST yield bounced up from the 1.86pc low of 10/15/14. But even since that mid-October 2014 depth, yields traveled up to only around 2.40pc, never piercing the important resistance around that level. The failure of UST yields to rally may signal future mediocre US (and worldwide) economic growth since yields generally advance during recovery (or hope of one).
Take the broad Goldman Sachs Commodity Index (GSCI) as a benchmark for commodities “in general”. It collapsed, of course aided by price dives in the petroleum complex, from 6/23/14’s interim high around 673 to under 520 recently. If sustained, this bloody price retreat will cut many statistical measures of inflation (and perhaps reduce inflation expectations). Thus it may encourage European and Japanese (and other) policy makers to embark on especially accommodative monetary policies. For example, the ECB may decide it has more need (justification) to quickly engage in massive QE, perhaps even by sovereign debt buying.
However, this GSCI weakness also may indicate underlying and ongoing risks to global economic growth as well as the difficulty of generating sufficient inflation in general. Moreover, sustained declines in petroleum prices may create crises in some producing nations that in turn spill over into other nations. For example, think of Russia (the ruble has moved over 50 versus the dollar), Nigeria, and Venezuela.

FOLLOW THE LINK BELOW to download this article as a PDF file.
Whatever It Takes- Recent Eurozone and Japanese Adventures (12-1-14)
Charts- FX and 10 Yr Govt Note of Eurozone and Japan (12-1-14, for essay Whatever It Takes)
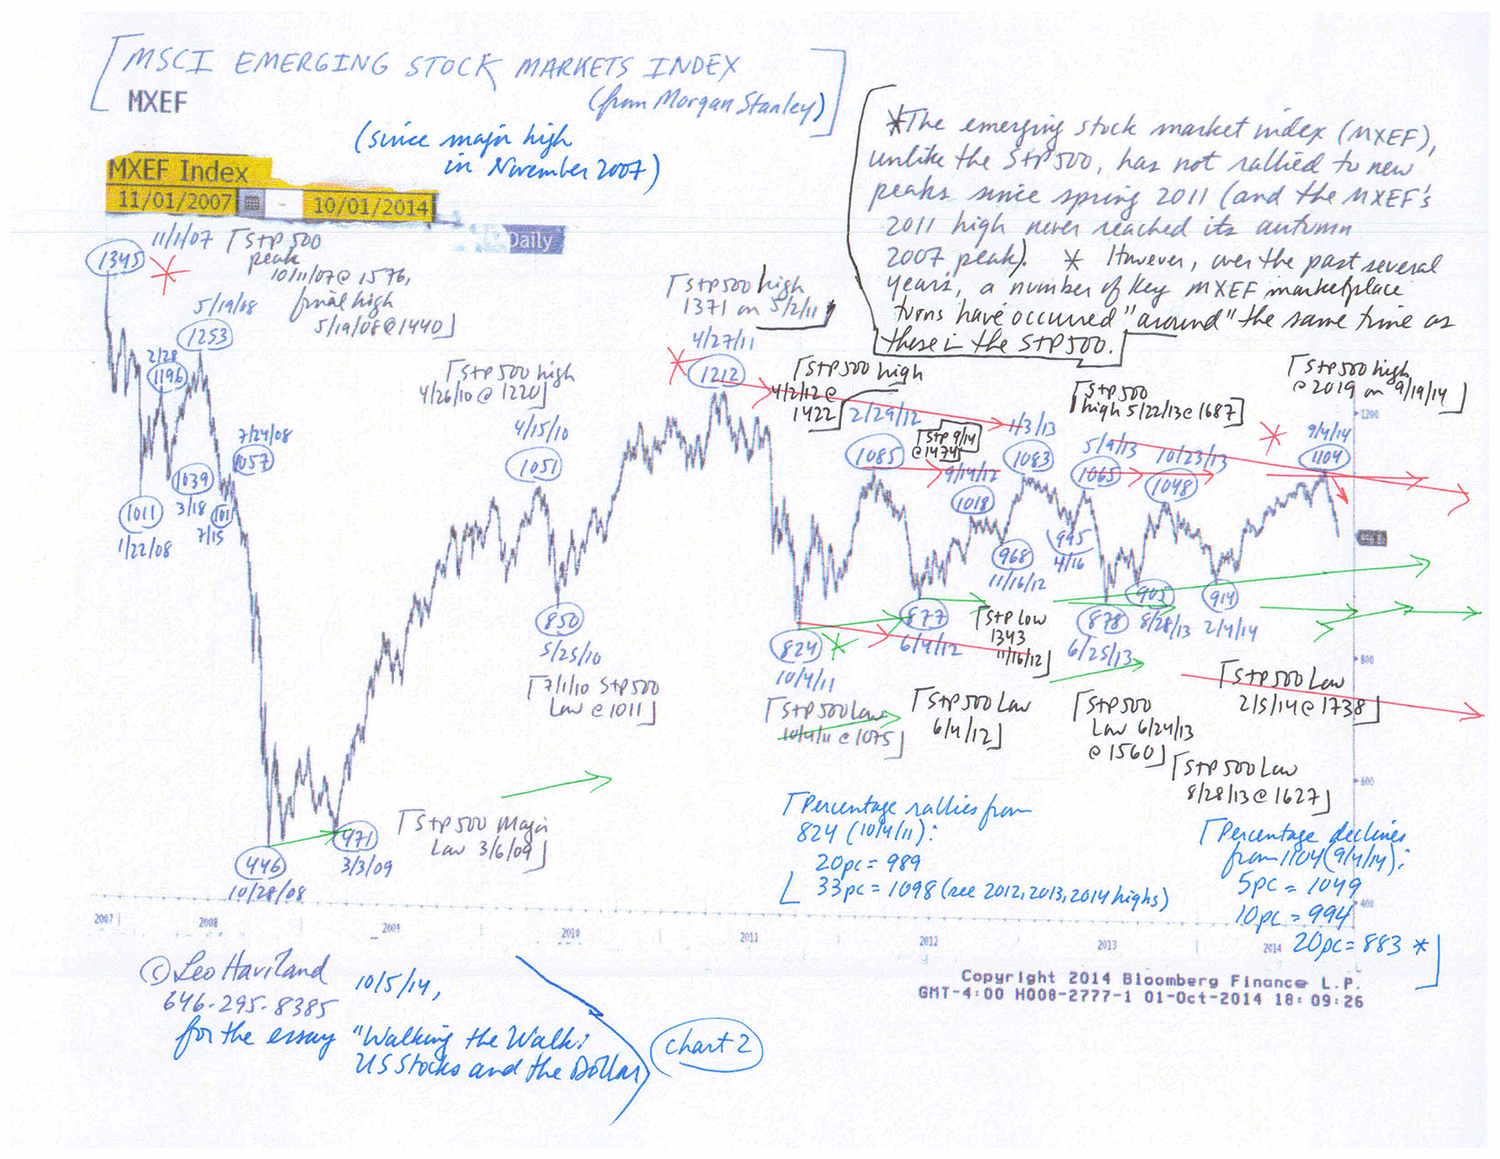
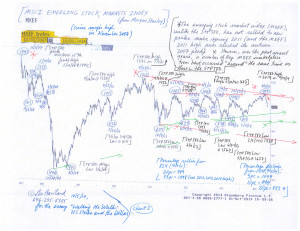
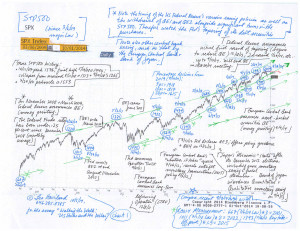
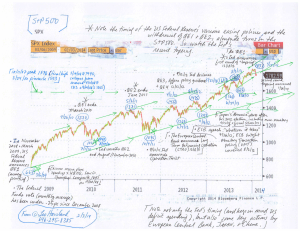
The recent advance in America’s broad real trade-weighted dollar index has attacked June 2012’s 86.3 high (Federal Reserve Board, H.10; March 1973=100, monthly average). That key top rests near August 2008’s 86.7, a level from which the dollar rallied sharply during the worldwide economic disaster that emerged in mid-2007 and accelerated during 2008. The broad real trade-weighted dollar (“TWD”) probably will climb higher (even if only modestly) over the next several months given the current trends in the US Treasury 10 year note, emerging stock marketplaces, and commodities in general. For these present-day marketplaces and their interrelations, keep in mind their 2007-2009 history. Moreover, the current level and probable near term climb in the TWD, when viewed in conjunction with trends in the UST 10 year and emerging stocks and commodities, indicate that a significant plateau in the S+P 500 is or soon will be in place. A walk in the TWD toward or above September 2008’s 88.8 (and especially) October 2008’s 93.9 increases the likelihood of a noteworthy S+P 500 peak.
After the Fed ceased its prior rounds of money printing, the 10 year UST note yield and the S+P 500 tumbled. Although that benevolent central bank embarked on a slow tapering process in mid-December 2013, America’s 10 year government note yields have meandered downhill from 1/2/04’s 3.05 percent top. Shouldn’t US longer term government interest rates tend to rise if significant real GDP growth or widespread hopes for it exist? In an interdependent international economy, the ongoing sideways to down trend in emerging marketplace stocks in general warns of slowing growth in advanced as well as developing nations. The retreat in the overall commodities complex roughly resembles that of emerging marketplace equities.
Are owners of US stocks complacent? Not only do many players in stocks and elsewhere have faith in the Fed. Over the past year and a half, the S+P 500’s percentage declines have been even smaller and of increasingly short duration. This probably has mitigated marketplace fears of a large stock retreat.
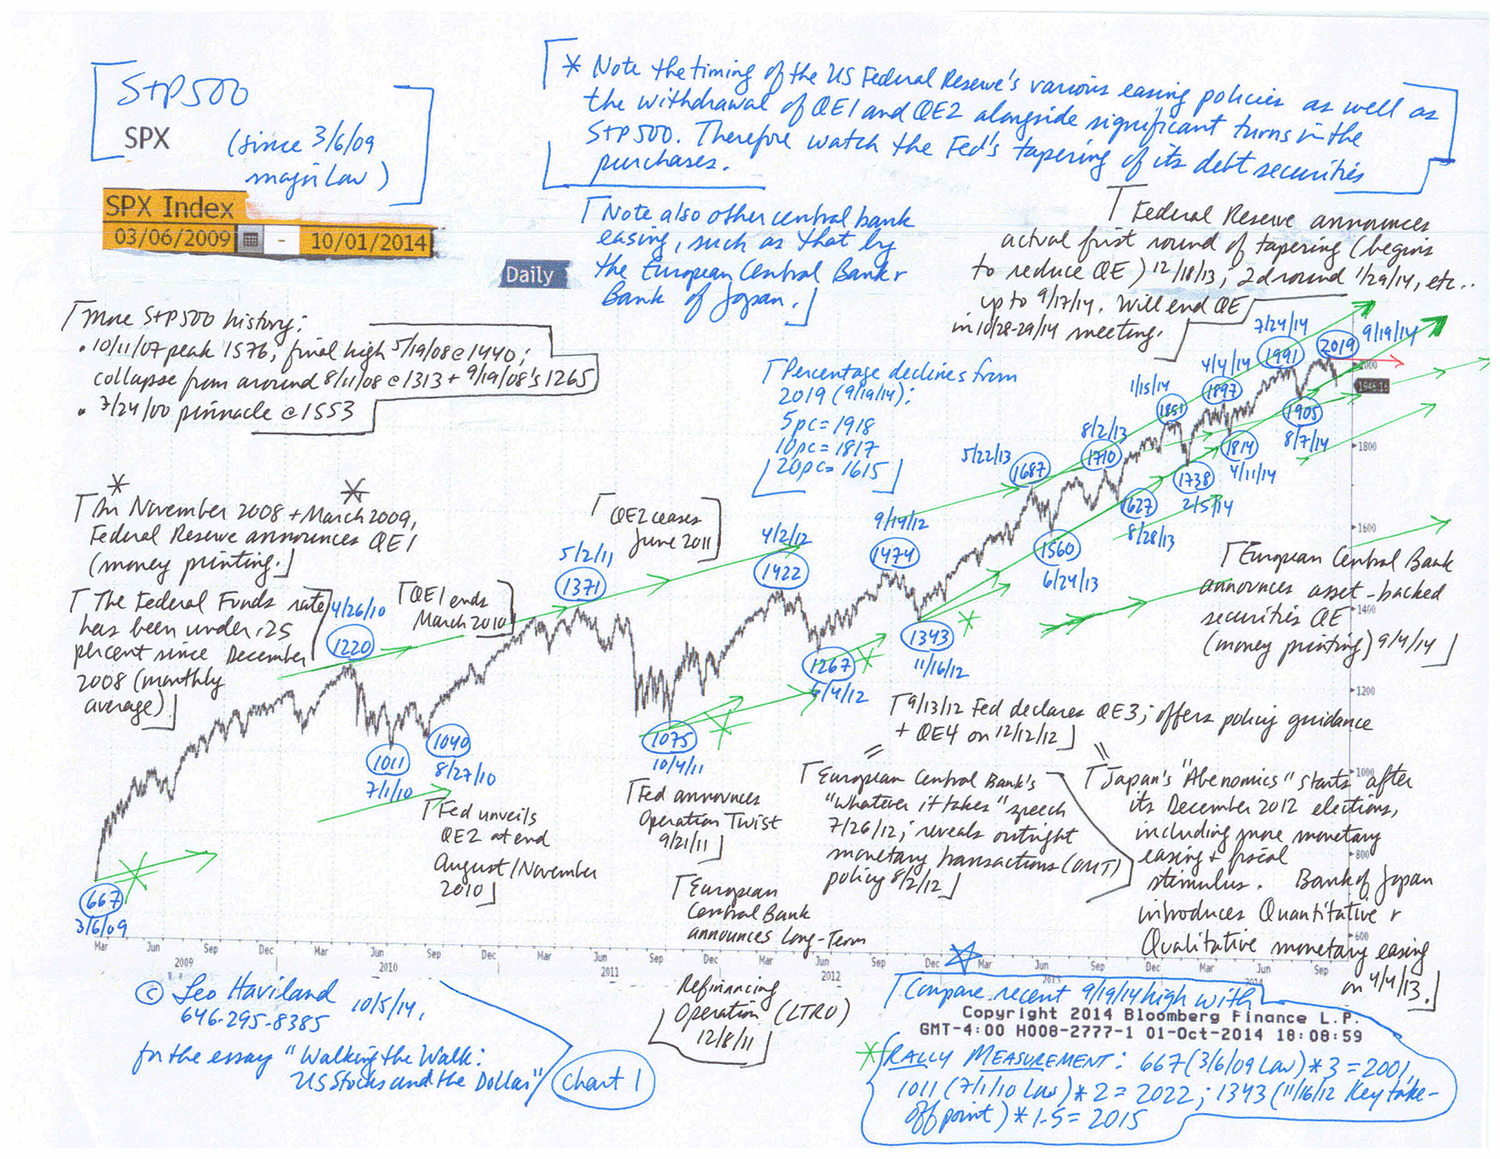
Measurement moves hint that the S+P 500 probably does not have much more room to travel upward for the near term relative to 9/19/14’s recent high at 2019. The 3/6/09 major low around 667*3 equals about 2000. The 7/1/10 low at 1011 times two is 2022. The key take-off point of 1343 on 11/16/12 (various renewed easing by the ECB, Fed, and Bank of Japan within several months before or after that date) times 1.5 is 2015. All these levels are around the recent high. Also, within the context of the current long run bull move in the S+P 500, October is an important anniversary month. Recall 10/11/07’s major peak 1576 and the significant 10/4/11 bottom at 1075.
FOLLOW THE LINK BELOW to download this article as a PDF file.
Walking the Walk- US Stocks and the Dollar (10-5-14)
Charts- S+P 500 and emerging stock marketplace index (10-5-14, for essay Walking the Walk- US Stocks and the Dollar)
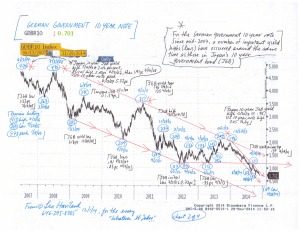
The dreadful economic crisis which emerged throughout the interconnected global economy after the departure of the Goldilocks Era in mid-2007 saw its darkest times in late 2008/early 2009. Politicians and central bankers around the globe took decisive action to escape and repair the disaster and to spark and sustain recovery. From late 2008/early 2009 through the ensuing years, dramatic United States Federal Reserve policy action, and especially massive quantitative easing (money printing), often has been associated with rising interest rates in the ten year US Treasury note. The ending of quantitative easing has connected with declines in the 10 year UST yield.
In the American theater, the past several years indicate that rising UST 10 year yields tie in with the reality of (or hopes for) at least a moderate economic recovery. Slumping UST rates are bound to the existence of (or fears about) more feeble US (and international) growth (or even worries that a downturn may occur). History of course need not repeat itself, and viewpoints change. Nevertheless, and despite America’s strong 2Q14 GDP expansion, the decline in UST 10 year yields over the course of the Fed’s current slow tapering program suggests that US and worldwide economic growth probably is and will remain mediocre.
The European Central Bank probably will embark on a modest money printing adventure in the relatively near future. However, all else equal, that decision likely will boost- but not substantially- the key German sovereign 10 year note yield (and 10 year government note yields in America and many other key nations).
Read the rest of this entry »
FOLLOW THE LINK BELOW to download this article as a PDF file.
Bond Yield Perspectives- Easing Comes, Easing Goes (9-1-14)
Charts- Ten Year Notes (9-1-14, for essay Bond Yield Perspectives- Easing Comes, Easing Goes)
Yet during the darkest days of the worldwide economic crisis of late 2008/early 2009 as well as during the subsequent recovery, Federal Reserve Board easy money policies have played key roles in encouraging bull moves in the S+P 500 (and many other equity playgrounds). Likewise, the elimination of some of these schemes, particularly previous rounds of quantitative easing (money printing), has occurred alongside highs in American stock benchmarks.
What does tapering foreshadow? The Fed’s recent decision to reduce (taper) and eventually eliminate the current gigantic round of money printing warns that a notable top is or relatively soon will be in place. Thus the mid-January 2014 high point in the S+P 500 arguably represents an important top. If a stock marketplace peak is not currently in place, one probably will be by around the end of first quarter 2014. Several other indicators likewise portend a plateau in the S+P 500. Fed tapering, to the extent it coincides with at least a modest decline in the S+P 500 and related indices, will hint that economic growth in America, other advanced nations, and developing and emerging countries will be less than predicted by guardians such as the International Monetary Fund.
FOLLOW THE LINK BELOW to download this market essay as a PDF file.
US Stocks- Shadows and Signals (2-3-14)
Chart- S+P 500 (2-3-14, for essay US Stocks- Shadows and Signals)