GLOBAL ECONOMICS AND POLITICS
Leo Haviland provides clients with original, provocative, cutting-edge fundamental supply/demand and technical research on major financial marketplaces and trends. He also offers independent consulting and risk management advice.
Haviland’s expertise is macro. He focuses on the intertwining of equity, debt, currency, and commodity arenas, including the political players, regulatory approaches, social factors, and rhetoric that affect them. In a changing and dynamic global economy, Haviland’s mission remains constant – to give timely, value-added marketplace insights and foresights.
Leo Haviland has three decades of experience in the Wall Street trading environment. He has worked for Goldman Sachs, Sempra Energy Trading, and other institutions. In his research and sales career in stock, interest rate, foreign exchange, and commodity battlefields, he has dealt with numerous and diverse financial institutions and individuals. Haviland is a graduate of the University of Chicago (Phi Beta Kappa) and the Cornell Law School.
Subscribe to Leo Haviland’s BLOG to receive updates and new marketplace essays.

These 12 electricity charts cover six hubs (PJM West, Mass Hub, Ercot North, SP 15, Palo Verde, and MidC) for winter 2013-14 (using January 2014 and February 2014 months) and the 2014-17 calendar strip (all four years, all months combined). The electricity chart commentary interrelates with viewpoints on NYMEX natural gas.
The assorted US electricity hubs do not always tell the same or even almost the same tale. In a particular electricity region, the perspective regarding seasons (including their supply/demand) are not always identical; summer may look much different than winter. The US electricity theater and its scenery of course is not exactly the same as that of natural gas. And the electricity and natural gas relationships for a given geographical region can vary, sometimes dramatically, from those elsewhere.
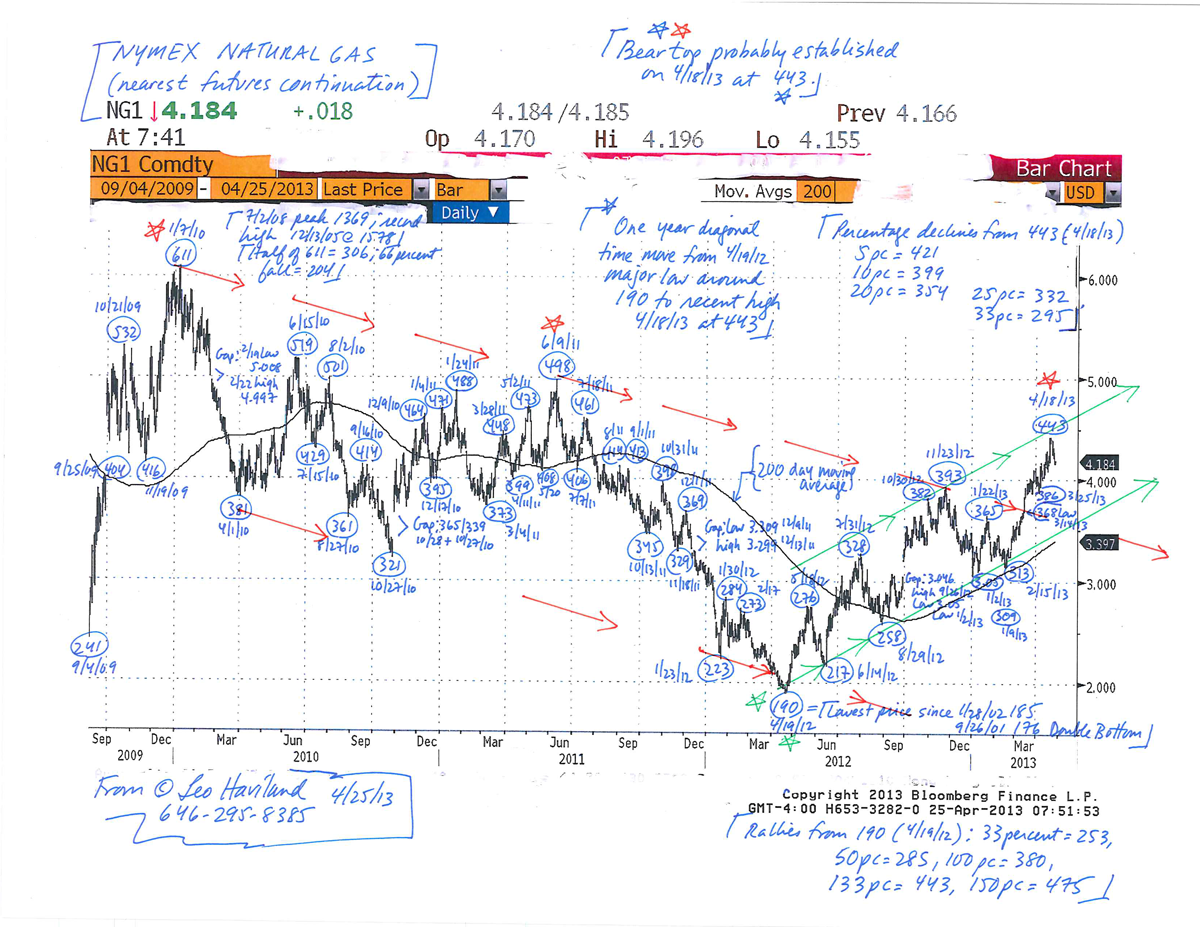
NYMEX natural gas started an important bear trend in spring 2013 (see, for example, the nearest futures continuation marketplace double top high of 4/18/13 at 4.429 and 5/1/13 at 4.444). It is a noteworthy story that price declines since late May 2013 in various electricity hubs for both winter 2013-14 and the calendar 2014-17 strip coincide with (actually, shortly preceded) the interim bear stage in NYMEX natural gas that commenced 5/28/13 (nearest futures 4.308). Since late May 2013, natural gas “in general” has not been tumbling lower on its own; the overall US electricity situation has closely intertwined with and encouraged it.
Note that according to the EIA, US total electricity consumption rises merely .7 percent in calendar 2013 versus calendar 2012. The EIA predicts American electricity demand in calendar 2014 climbs only about one percent relative to 2013 (Short-Term Energy Outlook, July 2013, Table 7a).
FOLLOW THE LINK BELOW to download this market essay as a PDF file.
Electricity Chart Analysis- a Scenic View (7-17-13)
Assuming normal weather, the United States natural gas inventory situation probably will remain around average levels (1990-2012 history) in days coverage terms as the April/October 2013 build season marches forward. Yet if NYMEX prices (nearest futures continuation basis) persist over 400, there is a modest risk that over the next several months greater stock increases than many forecasters predict will occur. In any event, even based on current Energy Information Administration (EIA) supply/demand estimates, by the end of winter 2013-14 draw season, US natural gas days coverage probably will be moderately above average. Also, not only has the major bull move from the dismal April 2013 bottom around 190 (4/19/13) to recent highs around 443 (4/18/13) been enormous (about 133 percent); it has been lengthy in time (a one year diagonal time move).
So what is the near term outlook for US natural gas prices (nearest futures continuation)? They probably will retreat further from around the levels reached in mid-April 2013. A 20 percent decline gives around 354; important support exists around the 305/310 1Q13 lows. What about the mystical time horizon called the long run? Suppose weather is normal and the American economy grows moderately. The longer run natural gas trend probably will be sideways, with the broad range roughly 280/310 to 490/520.
FOLLOW THE LINK BELOW to download this market essay as a PDF file.
Natural Gas Chart (NYMEX nearest futures) (4-25-13)
Natural Gas- the 2013 Build Up (4-25-13)
In commodity marketplaces, the price level and fluctuations of the spot (physical, cash) world and nearby (front) months generally attract and fascinate us more than periods (distant month contracts) out in the seemingly more misty future. In recent history, bull and bear moves in distant period NYMEX natural gas contracts to a substantial extent have mirrored those in the nearby months. Patterns in NYMEX natural gas strips, whether seasonal ones such as summer 2013 or calendar years such as 2014, 2015, and 2016, significantly resemble those of actual nearby months (and the nearest futures continuation contract perspective). For example, after marching upward and achieving peaks in spring 2011, they eventually fell off together, reaching dismal valleys in April 2012. The front months and distant spans then ascended dramatically, although not exactly the same distance. After this climb, they began to retreat together; recall the descent since late November 2012 (some trading periods started to fall off in price in October). The nearby and distant month trends thus have generally “confirmed” each other.
Nevertheless, any given natural gas near term situation is not always or necessarily the same as that of the more distant future (or ancient history) times. Because natural gas is not a cost of money commodity like gold, this similar directional relationship between spot (and front month) and forwards off in the distance is neither unchanging nor guaranteed. Some divergence may develop. Therefore marketplace players should monitor trends in NYMEX distant month natural gas contracts in addition to those of actual nearby months (and first futures continuation).
The long run major bull trend of the NYMEX natural gas complex that began in April 2012 (as represented by the nearest futures continuation bottom around 190 on 4/19/12) remains intact. However, at present the near term bearish retracement move for both nearby as well as distant month forwards such as the summer 2013 strip and the calendar strips of more faraway years also likely remains in place. See the nearest futures continuation high on 11/23/12 at 393.
The interim decline in natural gas that commenced during fourth quarter 2012 probably is near in time to at least an initial end. Assuming normal winter weather, the most likely time for this bearish NYMEX natural gas pattern to cease is in late calendar January or late calendar February 2013 (probably around nearest futures expiration). In any event, the price (nearest futures continuation basis) will not easily sustain falls beneath the 300 to 285 range (note recent lows on 1/2/13 at 305 and 1/9/13 at 309). Warmer than normal weather (as in last winter) could postpone the low (recall the late April 2012 depth). Given the likelihood of above normal US natural gas inventories in days coverage terms, there remains a significant chance of a final (second, double) bottom in late August or calendar September 2013.
As there are regional differences (basis relationships) between natural gas marketplaces, players should not restrict this comparative approach to NYMEX natural gas. Why not analyze near term relative to far out periods natural gas at a variety of different locations (and review related basis relationships over these vistas)? Also, given the links between natural gas and electricity fields, analysis of electricity marketplaces in more distant months in a given region offers insight into near term electricity trends as well as distant month (and even near term) natural gas battlegrounds.
Read the rest of this entry »