GLOBAL ECONOMICS AND POLITICS
Leo Haviland provides clients with original, provocative, cutting-edge fundamental supply/demand and technical research on major financial marketplaces and trends. He also offers independent consulting and risk management advice.
Haviland’s expertise is macro. He focuses on the intertwining of equity, debt, currency, and commodity arenas, including the political players, regulatory approaches, social factors, and rhetoric that affect them. In a changing and dynamic global economy, Haviland’s mission remains constant – to give timely, value-added marketplace insights and foresights.
Leo Haviland has three decades of experience in the Wall Street trading environment. He has worked for Goldman Sachs, Sempra Energy Trading, and other institutions. In his research and sales career in stock, interest rate, foreign exchange, and commodity battlefields, he has dealt with numerous and diverse financial institutions and individuals. Haviland is a graduate of the University of Chicago (Phi Beta Kappa) and the Cornell Law School.
Subscribe to Leo Haviland’s BLOG to receive updates and new marketplace essays.

Many observers point to booming corporate profits as a key reason for the splendid rally in United States stocks since March 2009’s dreary depth. The Federal Reserve’s generous highly accommodative monetary policy since late 2008, highlighted by sustained rock-bottom interest rates (yield repression) and several rounds of spectacular money printing, nevertheless coincides with this climb in corporate profits and the marvelous S+P 500 advance.
Many marketplace clairvoyants, including quite a few regulators, worry little about borrowing levels (and leverage) in the context of the wonderful ascent in American stocks. However, they should.
Soothsayers should examine New York Stock Exchange (NYSE Euronext) margin debt levels alongside the timing of Federal Reserve policy innovation and very important trend change points in the S+P 500. In recent years, pinnacles of NYSE margin debt have occurred close in time to those in US stocks; valleys in that debt roughly have coincided with S+P 500 troughs. Glancing back to the 2000 stock top and the depths of 2002/2003 shows a similar pattern. For the recent bull trend in American since first quarter 2009, underscore the Fed’s policy actions (and a couple
of European Central Bank ones) alongside these turning points in margin debt and American stocks. The most recent statistics (for January 2013) and the probable current margin debt levels are very elevated from the historical perspective. They consequently should concern marketplace watchers, even if many sentinels retain faith that there remains scope for even more margin debt and that lax Fed policies and booming corporate profits will persist.
Anyway, survey NYSE margin debt, Fed actions, and S+P 500 trends together. As in the joyous rally to the highs in US equities in 2007-08, judging from the NYSE margin debt statistics, a fair amount of leverage probably has encouraged the bull move in US equities since the March 2009 lows. That includes the recent S+P 500 spike since June 2012. The friendly Fed and its devoted allies probably deserve a hefty share, though not all, of the credit for these margin borrowing leaps since the equity abyss of first quarter 2009. And especially if US Treasury yields are low, why not search enthusiastically for yield (return) in US stocks?
FOLLOW THE LINK BELOW to download this market essay as a PDF file.
Margin Debt, Fed Policy, and Recent American Stock Price Trends (3-18-13)
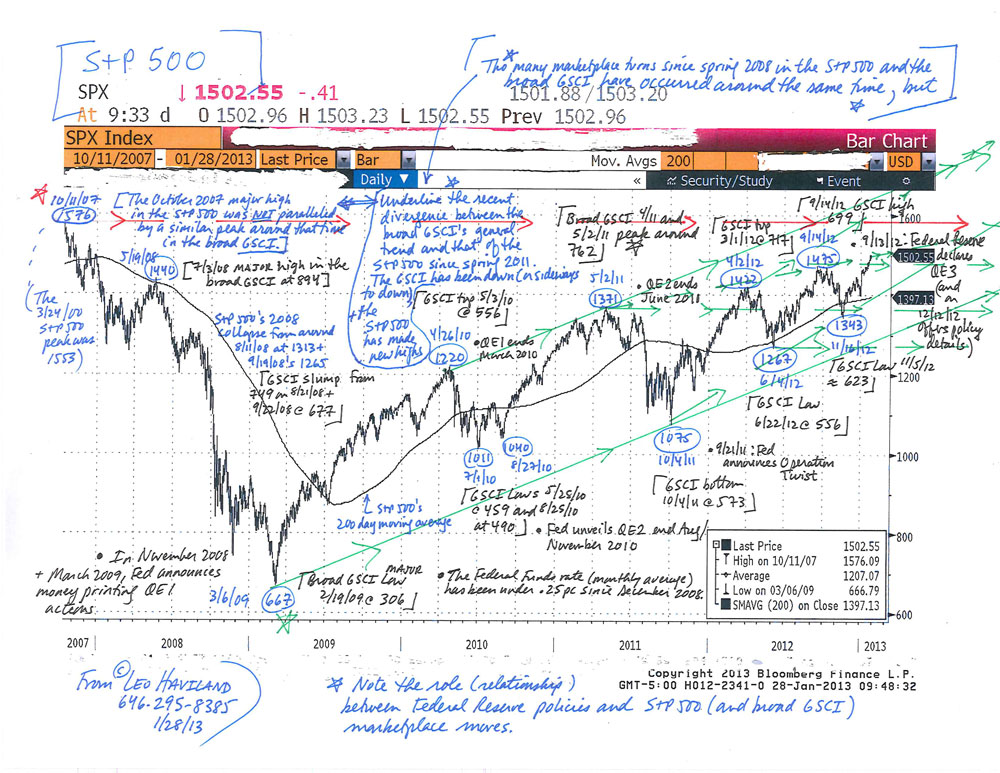
Since mid-2008, commodities “in general” and United States stocks “as a whole” have moved roughly in the same direction at around the same time. In this convergence process (relationship), noteworthy bull (bear) moves in US equities find parallels in those in the commodity arena. Thus significant marketplace rallies (declines) have tended to occur around the same time.
However, this perspective is not the only vantage point by which to assess the often close relationship between US equities and the commodities complex. There also is another, longer run view by which one can examine the relationship between them. Since spring 2011, commodities have ventured down (or sideways to down). However, key American stock benchmarks such as the S+P 500 have attained new highs, first in April 2012, then September 2012, and again in January 2013. Thus despite the convergence at assorted timely turning points since spring/ summer 2008, and even though the two territories continue to trade together to some extent, arguably there has been noteworthy divergence in their overall relationships (their trends) since May 2011.
Now recall several of 2007-08’s details. US equities peaked in October 2007, almost nine months before the commodity one in early summer 2008. Only after the final stock marketplace
summit in May 2008 did equities and commodities trade in close tandem. The current longer run relationship thus perhaps likewise reveals divergence, but with the commodity peak to date appearing well before any major S+P 500 one.
In contrast to 2007-08, what if the major peak in commodities is well before that in stocks (and the lag is likewise so great as to suggest divergence)? Suppose- and this admittedly is a key suppose- eventually commodities and US stocks will trade together over the long run. After all, so-called marketplace relationships can change dramatically, whether from the convergence/ divergence (lead/lag) perspective or otherwise. What does continued divergence, the failure of commodities to near or exceed its spring 2011 heights, suggest?
The 2007-08 relationship warns that the current continued failure of commodities to confirm the equity rally eventually will reveal a notable decline in stocks. Since the duration between the spring 2011 commodities top and today’s new highs in the S+P 500 is almost 20 months, whereas that between October 2007’s stock pinnacle and the broad GSCI’s summit in July 2008 was about nine months, the failure of the broad GSCI to achieve new heights should warn equity bulls that a decline may be fairly near in time.
FOLLOW THE LINK BELOW to download this market essay as a PDF file.
Commodities and US Stocks- Convergence and Divergence (1-28-13)
S+P 500 Chart (1-28-13, for essay on Commodities and US Stocks)
As Thanksgiving Day approaches and many prepare for holiday gatherings and festive feedings with family, friends, neighbors, and colleagues, several less-noticed marketplace courses deserve attention from marketplace travelers. United States Treasury International Capital (“TIC”) data reveal that gaping American federal fiscal deficits probably will find it difficult to lure sufficient foreign funds. Recent TIC evidence may warn of stock marketplace trend changes. Also, do foreign visitors find direct ownership (“investment”) in America highly appealing these days? What do New York Stock Exchange margin data unveil about major equity moves? Commodity Futures Trading Commission information on agricultural Index Traders not only offers a window on commodity price patterns in general. Perhaps surprisingly, that Index Trader information can illuminate and confirm marketplace voyages by stock benchmarks such as the S+P 500.
Since its 2009 depth, the high for agricultural Index Trader net long open interest occurred in 2010, at about 1.63 million contracts on 8/10/10. However, this quantity is not much above the more recent high net long position of 1.53mm on 4/26/11, which was close in time to the S+P 500 and broad GSCI elevations. By 10/4/11, the date of lows in the S+P 500 and the broad GSCI, the net IT long open interest had fallen to around 1.30mm. This equals about a 14.9pc dip from the 4/ 26/11 height. On 11/15/11, net IT was about 1.33mm contracts.
The recent percentage decline in IT length of nearly fifteen percent is fairly close to the initial fall of 16.7pc during 2008 (from 5/13/08 to 9/16/08). What would a sharp and sustained decline in the net IT long position under its 10/4/11 level indicate? It probably will coincide with declines in commodities in general and stocks, thus confirming a worsening of the worldwide economic crisis.
FOLLOW THE LINK BELOW to download this market essay as a PDF file.
Thanksgiving Marketplaces – Several Servings (11-22-11)