GLOBAL ECONOMICS AND POLITICS
Leo Haviland provides clients with original, provocative, cutting-edge fundamental supply/demand and technical research on major financial marketplaces and trends. He also offers independent consulting and risk management advice.
Haviland’s expertise is macro. He focuses on the intertwining of equity, debt, currency, and commodity arenas, including the political players, regulatory approaches, social factors, and rhetoric that affect them. In a changing and dynamic global economy, Haviland’s mission remains constant – to give timely, value-added marketplace insights and foresights.
Leo Haviland has three decades of experience in the Wall Street trading environment. He has worked for Goldman Sachs, Sempra Energy Trading, and other institutions. In his research and sales career in stock, interest rate, foreign exchange, and commodity battlefields, he has dealt with numerous and diverse financial institutions and individuals. Haviland is a graduate of the University of Chicago (Phi Beta Kappa) and the Cornell Law School.
Subscribe to Leo Haviland’s BLOG to receive updates and new marketplace essays.

What does historical analysis of noteworthy United States natural gas bear marketplace moves (NYMEX nearest futures continuation basis) reveal regarding the ending of the major bear trend that emerged in late February 2014? The mid-January 2015 low around 2.80 (NYMEX nearest futures continuation basis) could be, but probably is not, the final bottom. It is more likely that a final low will occur by end February 2015. The mid-January low probably will not be broken by much; in any event, substantial support lurks around 2.40.
Even if an observer focuses their attention on the natural gas price history variable alone, this is a very difficult marketplace call. In the current environment, much depends on weather, petroleum marketplace levels and trends (OPEC policy), whether (and how long) anticipated natural gas production jumps occur at current (or lower) gas prices, and the degree and duration of American economic strength. So the final bottom for natural gas may be postponed beyond February 2015.
Although history need not repeat itself, major natural gas lows (and highs) have not occurred in calendar March. April chronicles of course include the exceptional April 2012 major bottom; consequently, that calendar month represents a notable anniversary to watch, especially if weather for the balance of winter is warmer than normal. Gigantic inventories spurred the ferocious bear charge down to 1.90 in April 2012. However, assuming normal weather, and even allowing for increases in gas output, the current and probable US natural gas inventory situation looks relatively neutral, particularly in the context of NYMEX gas prices well under 4.00.
NYMEX natural gas reached many important troughs in late calendar August and September. However, a final low in late summer 2015 would stretch out the February 2014 bear marketplace longer than historical averages.
FOLLOW THE LINK BELOW to download this article as a PDF file.
Taking Shape- NYMEX Natural Gas Bear Trend History (1-19-15)
Assume normal weather for the United States natural gas 2014-15 winter draw period. Then the NYMEX natural gas complex in general probably will trade in a sideways trend. The broad range remains roughly 5.00/5.20 to 3.38/3.55 (NYMEX nearest futures continuation contract).
Unless the upcoming winter is much warmer than normal (or fears grow that it will be), or unless gas production spikes more than most prophets predict, then prices for NYMEX nearest futures probably will not attack major support around 3.00/3.13 during the next several months. Recall the 3.05 bottom on 1/2/13 (and the gap relative to the 3.046 high on 9/26/12) as well as 2/15/13’s 3.125 low and 8/8/13’s 3.129 trough. Given the low days coverage inventory situation, the NYMEX nearest futures continuation contract probably will challenge the 5.00/5.20 range during this upcoming draw season if the winter is significantly colder than normal (or concerns increase that it will be).
Despite the leap in United States natural gas production in calendar 2014, with a further moderate increase expected in 2015, natural gas days coverage at the end of October 2014 is significantly below average. Even by end March 2015, inventory days coverage probably will remain moderately below average (normal, typical, desired, reasonable, prudent) levels, though less so than at end October 2014. And though much can happen between now and October 2015, days coverage at end October 2015 arguably will rest under average levels.
FOLLOW THE LINK BELOW to download this article as a PDF file.
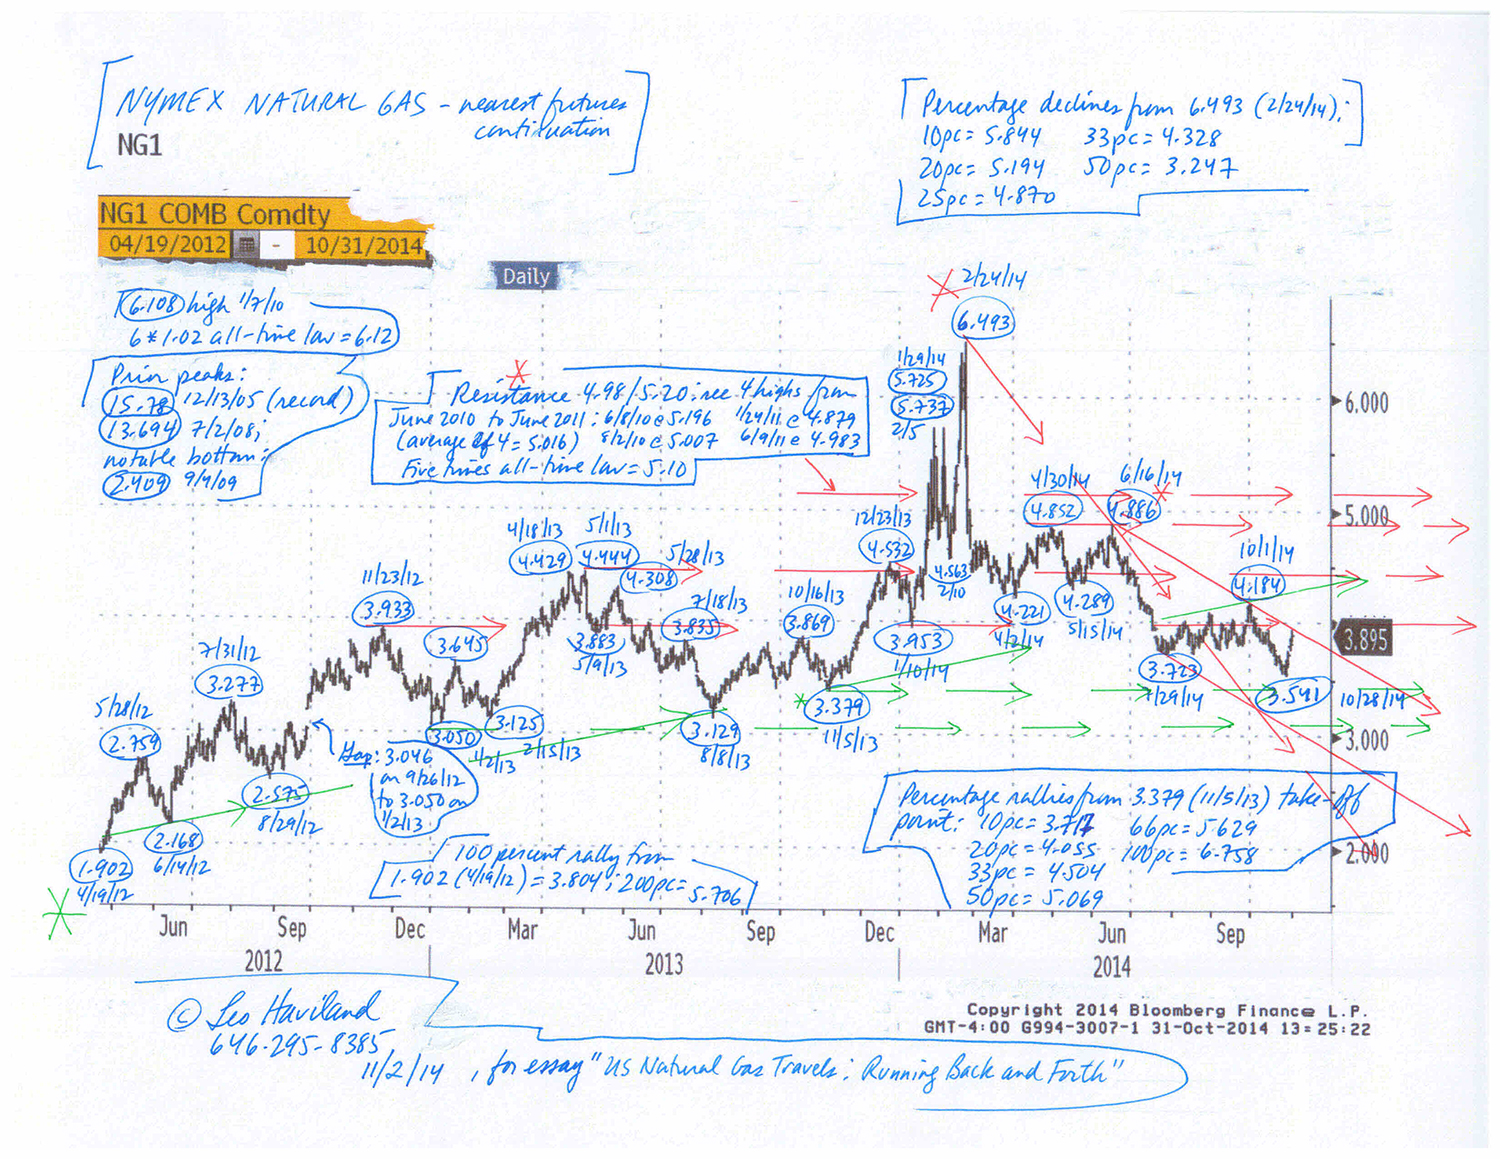
US Natural Gas Travels- Running Back and Forth (11-2-14)
Chart- NYMEX natural gas (nearest futures) (11-2-14, for essay US Natural Gas Travels)
Assuming normal weather, natural gas inventories in the United States Eastern Consuming Region at the end of the 2013 build season probably will range between roughly 2050bcf and 2100bcf. The midpoint of this range, 2075bcf, likely is about “normal” (average) for current United States supply and demand patterns.
Recall that end April 2012 Eastern Consuming Region peak working natural gas storage capacity for the region was 2219bcf. That total probably has been growing modestly since then. The Eastern Consuming Region therefore probably will not face a significant containment issue around the end of build season 2013, even if inventories reach around 2120bcf to 2135bcf.
The May 2013 STEO portrays how ECR year-on-year inventories from 1Q13 to 1Q14 catch up with and eventually surpass prior year levels. This is a bearish sign for gas prices.
Significantly, the 646bcf starting point for 2013 ECR inventory lurks a fair amount beneath the 733bcf average of the 2006-12 time frame. Consequently, the relatively low April 2013 ECR inventory total probably will be followed by a greater than average (relative to the 2006-12 vista) bcf increase.
FOLLOW THE LINK BELOW to download this market essay as a PDF file.
Natural Gas Inventory- the Eastern Consuming Region Build Season (5-13-13)
Petroleum prices will remain in a sideways to down trend. At least in the OECD, industry inventory in days coverage terms is currently higher than average. Due to renewed economic weakness and still relatively lofty oil prices, petroleum demand for the balance of 2011 and calendar 2012 probably will be less than many believe. Thus days coverage in the petroleum world probably will remain adequate for some time.
Petroleum remains partially hostage to variables of and trends and levels in key equity, currency, and interest rate (and other commodity) battlefields. Equity declines seem to be intertwining with those in the petroleum complex. Consumer balance sheets and incomes in the United States and many other nations remain under pressure. Substantial fiscal deficits (US, several European nations, perhaps Japan) undermine stock marketplace strength. A weak US dollar has convinced many that equities as well as petroleum prices should inevitably keep climbing, or at least stay high. However, a very (especially) weak US dollar situation- which seems to be emerging these days- may coincide with both feeble stocks and falling petroleum prices.
Petroleum bulls underline that if the economic recovery retains strength, supplies could get fairly tight unless OPEC raises its production quite a bit. Admittedly, as the Libyan situation shows, there’s always a chance that some event will significantly interrupt supplies. Some petroleum players therefore prefer to keep a handful of extra inventory around “just-in-case”. Alternative investment by noncommercial players has not evaporated. Some observers have faith that if the American economy weakens substantially, the Fed will engage in a third wave of quantitative easing (money printing) which would rally petroleum prices in nominal terms.
FOLLOW THE LINK BELOW to download this market essay as a PDF file.
Oil and Troubled Economic Waters (8-8-11)