GLOBAL ECONOMICS AND POLITICS

Leo Haviland provides clients with original, provocative, cutting-edge fundamental supply/demand and technical research on major financial marketplaces and trends. He also offers independent consulting and risk management advice.

Haviland’s expertise is macro. He focuses on the intertwining of equity, debt, currency, and commodity arenas, including the political players, regulatory approaches, social factors, and rhetoric that affect them. In a changing and dynamic global economy, Haviland’s mission remains constant – to give timely, value-added marketplace insights and foresights.

Leo Haviland has three decades of experience in the Wall Street trading environment. He has worked for Goldman Sachs, Sempra Energy Trading, and other institutions. In his research and sales career in stock, interest rate, foreign exchange, and commodity battlefields, he has dealt with numerous and diverse financial institutions and individuals. Haviland is a graduate of the University of Chicago (Phi Beta Kappa) and the Cornell Law School.


Subscribe to Leo Haviland’s BLOG to receive updates and new marketplace essays.

RSS View Leo Haviland's LinkedIn profile View Leo Haviland’s profile


US NATURAL GAS: ON THE ROAD © Leo Haviland August 2, 2015

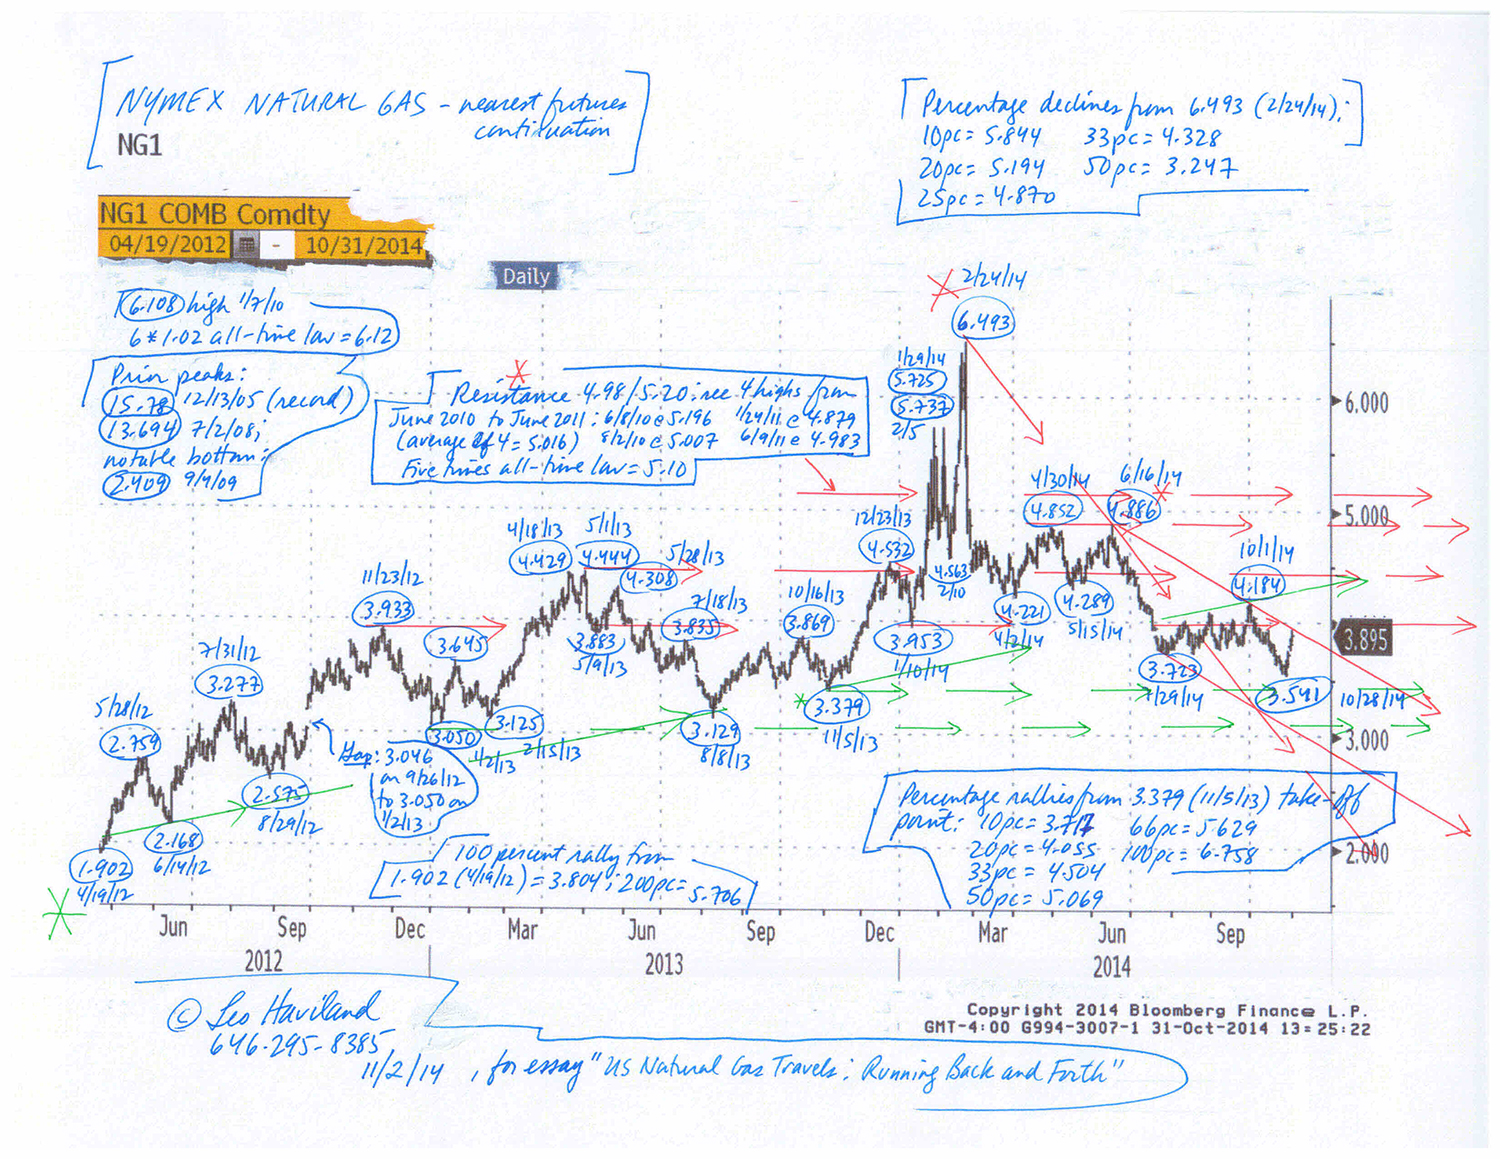
The probable avenue for the United States natural gas marketplace (NYMEX nearest futures continuation basis) for the next several months is a range between 2.15 and 3.40. The major bear trend that followed 2/24/14’s major peak at 6.493 attained a key bottom with 4/27/15’s 2.443 low. Was this a major low? Perhaps, but prices probably will challenge that level again and perhaps modestly break it over the next several months.

But why? After all, assuming normal weather, current and anticipated upcoming natural gas days coverage through winter 2015-16 tend to support prices, particularly in the context of NYMEX natural gas prices well under 4.00. Historical analysis indicates the bear trend from February 2014 to April 2015 travelled sufficiently far in price and duration terms to justify a shift to a neutral to bullish outlook. Also, the last prior major low, 1.902 on 4/19/12, likewise occurred in calendar April. Many key bottoms have occurred around contract expiration. In addition, many significant marketplace trend changes in natural gas (and petroleum) roughly coincide with very elevated net long or short noncommercial positions. From the historical perspective, the net noncommercial short position was very large around the time of April 2015’s low; the net noncommercial length likewise was substantial around the time of the February 2014 peak.

Natural gas prices often travel substantially independently of both petroleum (and commodities “in general”) and so-called “international” or “financial” factors. However, especially since mid-to-late June 2014 and into calendar 2015, bearish natural gas price movements have intertwined with those in the petroleum complex and the bull move in the broad real trade-weighted US dollar. The retreats since their spring 2015 highs in the commodities complex in general and petroleum in particular fit with similar slumps in natural gas. Petroleum likely will remain weak and the US dollar will remain strong for the near term, which will be bearish factors for American natural gas prices.

Quite a few marketplace observers believe the US natural gas marketplace will have massive inventories at the end of calendar 2016 build season (end October). This bearish perspective also weighs on prices. Although such oversupply probably will not occur (assume normal weather), such views are not unreasonable.

FOLLOW THE LINK BELOW to download this article as a PDF file.
US Natural Gas- On the Road (8-2-15)

ROLLIN’ AND TUMBLIN’ IN US NATURAL GAS © Leo Haviland April 20, 2015

In all marketplace battlefields, a wide variety of storytellers select between (and emphasize differently) an array of variables. They thereby generate diverse bullish and bearish arguments that heatedly compete for allegiance and action. And analysis and trading always are difficult enterprises. However, in the United States natural gas universe nowadays, the noise, smoke, and uncertainty produced by these diverse variables and conflicting perspectives and recommendations make it especially challenging to boldly swear unquestioning loyalty to a particular marketplace viewpoint.

What does historical analysis of major United States natural gas bear marketplace moves (NYMEX nearest futures continuation basis) in the context of days coverage reveal regarding the ending of the major bear trend that emerged in late February 2014? Perhaps 4/13/15’s 2.475 low was an important trough; however, several days of course remain in April and many key bottoms have occurred around contract expiration. If a noteworthy bottom is not established in calendar April 2015, the most probable time for a major low is in late August/calendar September 2015. NYMEX natural gas reached many important bottoms in late calendar August and September. However, a final low in late summer 2015 would stretch out the February 2014 bear marketplace trend substantially longer than the historical average.

In any case, if NYMEX natural gas prices pierce 4/13/15’s low (nearest futures continuation), that level probably will not be broken by much. Substantial support lurks around 2.40 and 2.20/2.15.
****

End March 2015’s 20.0 days of coverage (1471bcf divided by about 73.5bcf/day of full calendar year 2014 consumption), though way up from March 2014’s 12.0 days coverage, dips slightly under the 21.8 days end March 1990-2014 average. It also falls a notable, though not extreme, 4.1 days beneath the nine year 2006-14 average. Thus despite the notable arithmetic stock increase during calendar 2014 build season, the national days coverage inventory picture at the end of winter 2014-15 draw season is slightly bullish.

What’s the bottom line in regard to the natural gas bear trend that began in February 2014 if one concentrates on the natural gas inventory variable? With the NYMEX nearest futures natural gas price currently well under 4.00, this end winter 2014-15 inventory factor “taken by itself”, looks neutral to supportive for gas prices. This fundamental consideration should be interpreted alongside the marketplace history relating to price and time factors.

End October 2015’s 49.5 days coverage level slides 6.3 days beneath the 2006-14 end October average of 55.8 days and 4.1 days under 1990-2014’s 53.6 days. This end October 2015 days coverage total therefore is bullish (even if not wildly so given prospects of increased natural gas production).

Look further out in the murky future to March and October 2016. Although much of course can happen between now and then, potential days coverage nevertheless does not suggest notable oversupply relative to historic averages.

The EIA forecasts end March 2016 inventory at 1704bcf and end October 2016 stocks at 3923bcf. Days cover at end March 2016 will be around 22.3 days (1704bcf/76.3bcf/d). Though this is slightly (.5 day) above the 21.8 day 1990-2014 average, it is 1.8 day less than 2006-14’s 24.1 day average. October 2016’s hypothetical days coverage is 51.7 days (3923bcf/75.8bcf/d. This is about 1.9 days under the 1990-2014 average for that calendar month and 4.1 days beneath 2006-14’s 55.8 day average.

FOLLOW THE LINK BELOW to download this article as a PDF file.
Rollin' and Tumblin' in US Natural Gas (4-20-15)

TAKING SHAPE: NYMEX NATURAL GAS BEAR TREND HISTORY © Leo Haviland January 19, 2015

What does historical analysis of noteworthy United States natural gas bear marketplace moves (NYMEX nearest futures continuation basis) reveal regarding the ending of the major bear trend that emerged in late February 2014? The mid-January 2015 low around 2.80 (NYMEX nearest futures continuation basis) could be, but probably is not, the final bottom. It is more likely that a final low will occur by end February 2015. The mid-January low probably will not be broken by much; in any event, substantial support lurks around 2.40.

Even if an observer focuses their attention on the natural gas price history variable alone, this is a very difficult marketplace call. In the current environment, much depends on weather, petroleum marketplace levels and trends (OPEC policy), whether (and how long) anticipated natural gas production jumps occur at current (or lower) gas prices, and the degree and duration of American economic strength. So the final bottom for natural gas may be postponed beyond February 2015.

Although history need not repeat itself, major natural gas lows (and highs) have not occurred in calendar March. April chronicles of course include the exceptional April 2012 major bottom; consequently, that calendar month represents a notable anniversary to watch, especially if weather for the balance of winter is warmer than normal. Gigantic inventories spurred the ferocious bear charge down to 1.90 in April 2012. However, assuming normal weather, and even allowing for increases in gas output, the current and probable US natural gas inventory situation looks relatively neutral, particularly in the context of NYMEX gas prices well under 4.00.

NYMEX natural gas reached many important troughs in late calendar August and September. However, a final low in late summer 2015 would stretch out the February 2014 bear marketplace longer than historical averages.

FOLLOW THE LINK BELOW to download this article as a PDF file.
Taking Shape- NYMEX Natural Gas Bear Trend History (1-19-15)

US NATURAL GAS TRAVELS: RUNNING BACK AND FORTH © Leo Haviland November 2, 2014

Assume normal weather for the United States natural gas 2014-15 winter draw period. Then the NYMEX natural gas complex in general probably will trade in a sideways trend. The broad range remains roughly 5.00/5.20 to 3.38/3.55 (NYMEX nearest futures continuation contract).

Unless the upcoming winter is much warmer than normal (or fears grow that it will be), or unless gas production spikes more than most prophets predict, then prices for NYMEX nearest futures probably will not attack major support around 3.00/3.13 during the next several months. Recall the 3.05 bottom on 1/2/13 (and the gap relative to the 3.046 high on 9/26/12) as well as 2/15/13’s 3.125 low and 8/8/13’s 3.129 trough. Given the low days coverage inventory situation, the NYMEX nearest futures continuation contract probably will challenge the 5.00/5.20 range during this upcoming draw season if the winter is significantly colder than normal (or concerns increase that it will be).

Despite the leap in United States natural gas production in calendar 2014, with a further moderate increase expected in 2015, natural gas days coverage at the end of October 2014 is significantly below average. Even by end March 2015, inventory days coverage probably will remain moderately below average (normal, typical, desired, reasonable, prudent) levels, though less so than at end October 2014. And though much can happen between now and October 2015, days coverage at end October 2015 arguably will rest under average levels.
Chart--NYMEX-natural-gas-(nearest-futures)-(11-2-14,-for-essay-US-Natural-Gas-Travels)

FOLLOW THE LINK BELOW to download this article as a PDF file.
US Natural Gas Travels- Running Back and Forth (11-2-14)
Chart- NYMEX natural gas (nearest futures) (11-2-14, for essay US Natural Gas Travels)