GLOBAL ECONOMICS AND POLITICS

Leo Haviland provides clients with original, provocative, cutting-edge fundamental supply/demand and technical research on major financial marketplaces and trends. He also offers independent consulting and risk management advice.

Haviland’s expertise is macro. He focuses on the intertwining of equity, debt, currency, and commodity arenas, including the political players, regulatory approaches, social factors, and rhetoric that affect them. In a changing and dynamic global economy, Haviland’s mission remains constant – to give timely, value-added marketplace insights and foresights.

Leo Haviland has three decades of experience in the Wall Street trading environment. He has worked for Goldman Sachs, Sempra Energy Trading, and other institutions. In his research and sales career in stock, interest rate, foreign exchange, and commodity battlefields, he has dealt with numerous and diverse financial institutions and individuals. Haviland is a graduate of the University of Chicago (Phi Beta Kappa) and the Cornell Law School.


Subscribe to Leo Haviland’s BLOG to receive updates and new marketplace essays.

RSS View Leo Haviland's LinkedIn profile View Leo Haviland’s profile


ECONOMIC AND POLITICAL LINES (c) Leo Haviland October 22, 2012

Highlight two International Monetary Fund comments in its recently unveiled “Fiscal Monitor” (October 2012). “With downside risks in the global economy mounting, policymakers must once again tread the narrow path that will permit them to continue strengthening the public finances while avoiding an excessive withdrawal of fiscal support for a still-fragile economic recovery.” (page ix). And: “In most advanced economies, the near-term fiscal stance has to walk the fine line between continued adjustment and supporting the economy.” (p6).

This IMF rhetoric, which many other luminaries embrace, of “tread the narrow path” and “walk the fine line” offers hope for the global economy and for the United States in particular. Maybe subtle financial and political sorcerers somehow can escape the dilemma of an economic downturn (too slow growth or recession) and the consequences of additional (irresponsible) substantial deficit spending! Have faith that wise guardians can discover a middle way to evade further suffering!

In the amazing Goldilocks Era, didn’t substantial and growing worldwide debt and leverage joyously promise and provide nearly limitless opportunity for almost everyone (“us”) to prosper with very little (or at least manageable) risk? In the aftermath of the wonderful Goldilocks epoch, should we believe that the implications of significant leverage and mountainous debt accumulation can be magically pain-free, at least over some misty medium term or long run vista?

Despite such entrancing sermons of narrow paths and fine lines from many respected central banking and political guides, economic and political pilgrims should ask if such a path or line exists in practice. It probably doesn’t. Is there really a way for the United States to avoid the looming fiscal cliff and other long run deficit challenges without significant hardship? Probably not.

Most observers are not focusing closely on the potential composition of the Senate. They should. The Senate election result probably will have notable consequences for legislative action (or inaction) in many domains. For example, think of the troubling fiscal cliff and the terrifying long run deficit problems.

Clairvoyants on balance believe the Democrats probably will maintain control of the Senate. Even if the Republicans gain an edge in the Senate, it would be very surprising for them to capture anything close to 60 seats. According to Senate rules, to end debate (halt filibusters) on a legislative proposal (bill), 60 of the 100 Senators must agree to do so (invoke cloture). The sixty votes do not have to all be from the same party. Nevertheless, the failure of a Senate majority party to control 60 or more Senate seats means that its opponents generally can block the majority party’s legislative efforts.

So suppose the House is Republican, and the Senate is Democratic (or even imagine a modest Republican majority). Given such Congressional division, it will be a major challenge for the parties to readily resolve issues over which they disagree dramatically, such as on how to repair the federal deficit disaster. In that situation, the party membership of the winner of the duel for the Presidency matters much less. After all, for the past several years, the Republican House and the Democratic Senate stubbornly have faced each other. With these battle lines, there has been at best little progress on reducing the deficit. Why should having a Republican President instead of a Democratic one change this partisan deadlock in any notable fashion?

FOLLOW THE LINK BELOW to download this market essay as a PDF file.
Economic and Political Lines (10-22-12)
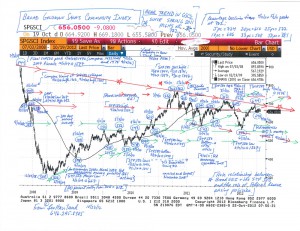
Chart- Commodities- Broad GSCI (10-22-12)

US PETROLEUM- TAKING STOCK © Leo Haviland, May 8, 2012

Crude oil streams and various refined products create an array of petroleum supply/demand pictures. Although America of course is not the entire oil universe, a survey of the recent overall United States petroleum inventory scene offers insight into the general petroleum price trend. Also recall the linkage in recent years of major trends between the S+P 500 and the petroleum complex (and commodities “in general”). This analysis of petroleum inventories in context underlines the current bearish trends in petroleum and the S+P 500.

At end March, US oil industry total inventory averages 50.3 days coverage (1996-2011, crude and products combined relative to total product supplied per day for that calendar month, Energy Information Administration inventory data; Strategic Petroleum Reserve stocks not included). End March 2012 days coverage climbed to 58.9 days supply. Not only did this soar more than eight days above average. It established a new record for that calendar month for the 1996- present era. Although the United States economy has been in a recovery for almost three years, these inventories broke beyond March 2009’s 58.2 day summit, achieved in the depths of the worldwide economic crisis and the month of the S+P 500’a major low (3/6/09 at 667).

These high supplies for March 2012 are not a one month aberration. Glance at the previous three months in historical context. From 1996 through end 2011, average total inventory for December is 50.2 days, January 51.0 days, and February 50.0 days. December 2011 ascended to a new record high for that calendar month; its 56.3 days of supply decisively beat 1998’s 55.4 days. What about January 2012? Not only is its 58.9 days coverage about eight days above average. They smash January 2010’s top of 56.8 days (compare January 2009’s lofty 55.8 days). February 2012’s 57.9 days coverage likewise significantly exceeds its calendar month average. Its huge days coverage decisively climbs over the previous stockpile record of 56.9 days achieved in February 2009.

As of 4/27/12 (weekly EIA data), US petroleum industry inventory slipped to around 56.9 days of supply (average daily total product supplied for the most recent four weeks). Total oil industry stocks nevertheless remain ample from the days coverage perspective. Although not a new end April record elevation (2009 was 58.8 days), it still vaults more than five days over end April’s 51.5 days coverage average.

On balance, just-in-case fears regarding petroleum inventory probably are diminishing, and will continue to do so for a while longer. A bear trend in petroleum prices probably also will interrelate with attitudes regarding just-in-case inventory management. If prices are dropping, why worry quite so much about supplies, right? ****

Analysis of NYMEX noncommercial petroleum positions indicates they probably reached a peak recently. Liquidation by net noncommercial longs probably has helped to move oil prices lower and probably will continue to do so.

FOLLOW THE LINK BELOW to download this market essay as a PDF file.
Petroleum- Taking Stock (5-8-12)
NYMEX Crude Oil (5-8-12)