GLOBAL ECONOMICS AND POLITICS
Leo Haviland provides clients with original, provocative, cutting-edge fundamental supply/demand and technical research on major financial marketplaces and trends. He also offers independent consulting and risk management advice.
Haviland’s expertise is macro. He focuses on the intertwining of equity, debt, currency, and commodity arenas, including the political players, regulatory approaches, social factors, and rhetoric that affect them. In a changing and dynamic global economy, Haviland’s mission remains constant – to give timely, value-added marketplace insights and foresights.
Leo Haviland has three decades of experience in the Wall Street trading environment. He has worked for Goldman Sachs, Sempra Energy Trading, and other institutions. In his research and sales career in stock, interest rate, foreign exchange, and commodity battlefields, he has dealt with numerous and diverse financial institutions and individuals. Haviland is a graduate of the University of Chicago (Phi Beta Kappa) and the Cornell Law School.
Subscribe to Leo Haviland’s BLOG to receive updates and new marketplace essays.

The classic American song “Home on the Range” requests:
“Oh give me a home where the buffalo roam,
Where the deer and the antelope play,
Where seldom is heard a discouraging word,
And the skies are not cloudy all day.”
****
CONCLUSION AND OVERVIEW
Did the major bull trend for NYMEX natural gas (nearest futures continuation) that started with 3/4/16’s dismal 1.611 depth finish with 12/28/16’s 3.994 top? Although it is a difficult call, assuming normal weather and moderate United States economic growth, it will be hard for the NYMEX front month price to exceed the high neighboring 4.00 by much (if at all) over the next few months. However, significant support rests around 2.50 (lows 8/12/16 at 2.523, 11/9/16 at 2.546, and 2/22/17 at 2.522; high 1/8/16 at 2.495).
The bull trends that began around first quarter 2012 (4/19/12’s 1.902) and during 1Q16 display many similarities, including their commencement following substantial oversupply conditions. Yet bearish signs exist in regard to the 2016 bull charge. The distance and duration travelled by 2016’s bull climb up to its December 2016 height, though less than average for major bull natural gas moves in NYMEX natural gas (nearest futures continuation), was within the historical range. Several previous major peaks in NYMEX natural gas occurred in calendar December. Current US natural gas inventories are above average. The CFTC’s net long commercial position is very high and consequently vulnerable to liquidation. And the 2012 rally showed an interim high in springtime (5/1/13 at 4.444).
As always, audiences should be cautious about linking natural gas price patterns with those in petroleum and other financial marketplaces. And apparent convergence/divergence (lead/lag) relationships between marketplaces can change, sometimes dramatically. However, these other playgrounds currently suggest that natural gas will struggle to advance above 12/28/16’s 3.994 anytime soon. See “The Oil Battlefield: Evolution, Relationships, and Prices” (4/10/17). Note also “Eurozone Under Siege: Currency Trends and Politics” (3/20/17), “Easing Comes, Easing Goes: US Government Interest Rates” (3/13/17), “Rhetoric and Global Currency Trends” (2/13/17), “Gold and Goldilocks: 2017 Marketplaces” (1/10/17), “Back to the Future: the Marketplace Time Machine” (12/13/16). Even the price gap from 3.568 (1/3/17) to 3.690 (12/30/16) represents a formidable near term roadblock.
However, what does looking further around the corner reveal? Everyone knows “much can happen” over the next six months and thereafter. Yet US natural gas days coverage at the end of inventory build season 2017 (October 2017) probably will be slightly bullish, with that (in the admittedly even cloudier distant horizon) at end build season 2018 more so. Thus an eventual retest of a ceiling around 4.00/4.10 is a reasonable conjecture. Looking ahead over the next several months, it probably will take a much colder than normal winter 2017-18 for the price to stay above 4.00/4.10 for long, and especially to spike above resistance at 4.45 to 4.55. Recall that winter 2013-14 required a freeze and resultant sharp stock draw to soar above the May 2013 and 12/23/13 (4.532) highs. Remember too the price collapse from 11/10/14’s 4.544.
FOLLOW THE LINK BELOW to download this article as a PDF file.
US Natural Gas- Home on the Range (4-15-17)
The probable avenue for the United States natural gas marketplace (NYMEX nearest futures continuation basis) for the next several months is a range between 2.15 and 3.40. The major bear trend that followed 2/24/14’s major peak at 6.493 attained a key bottom with 4/27/15’s 2.443 low. Was this a major low? Perhaps, but prices probably will challenge that level again and perhaps modestly break it over the next several months.
But why? After all, assuming normal weather, current and anticipated upcoming natural gas days coverage through winter 2015-16 tend to support prices, particularly in the context of NYMEX natural gas prices well under 4.00. Historical analysis indicates the bear trend from February 2014 to April 2015 travelled sufficiently far in price and duration terms to justify a shift to a neutral to bullish outlook. Also, the last prior major low, 1.902 on 4/19/12, likewise occurred in calendar April. Many key bottoms have occurred around contract expiration. In addition, many significant marketplace trend changes in natural gas (and petroleum) roughly coincide with very elevated net long or short noncommercial positions. From the historical perspective, the net noncommercial short position was very large around the time of April 2015’s low; the net noncommercial length likewise was substantial around the time of the February 2014 peak.
Natural gas prices often travel substantially independently of both petroleum (and commodities “in general”) and so-called “international” or “financial” factors. However, especially since mid-to-late June 2014 and into calendar 2015, bearish natural gas price movements have intertwined with those in the petroleum complex and the bull move in the broad real trade-weighted US dollar. The retreats since their spring 2015 highs in the commodities complex in general and petroleum in particular fit with similar slumps in natural gas. Petroleum likely will remain weak and the US dollar will remain strong for the near term, which will be bearish factors for American natural gas prices.
Quite a few marketplace observers believe the US natural gas marketplace will have massive inventories at the end of calendar 2016 build season (end October). This bearish perspective also weighs on prices. Although such oversupply probably will not occur (assume normal weather), such views are not unreasonable.
FOLLOW THE LINK BELOW to download this article as a PDF file.
US Natural Gas- On the Road (8-2-15)
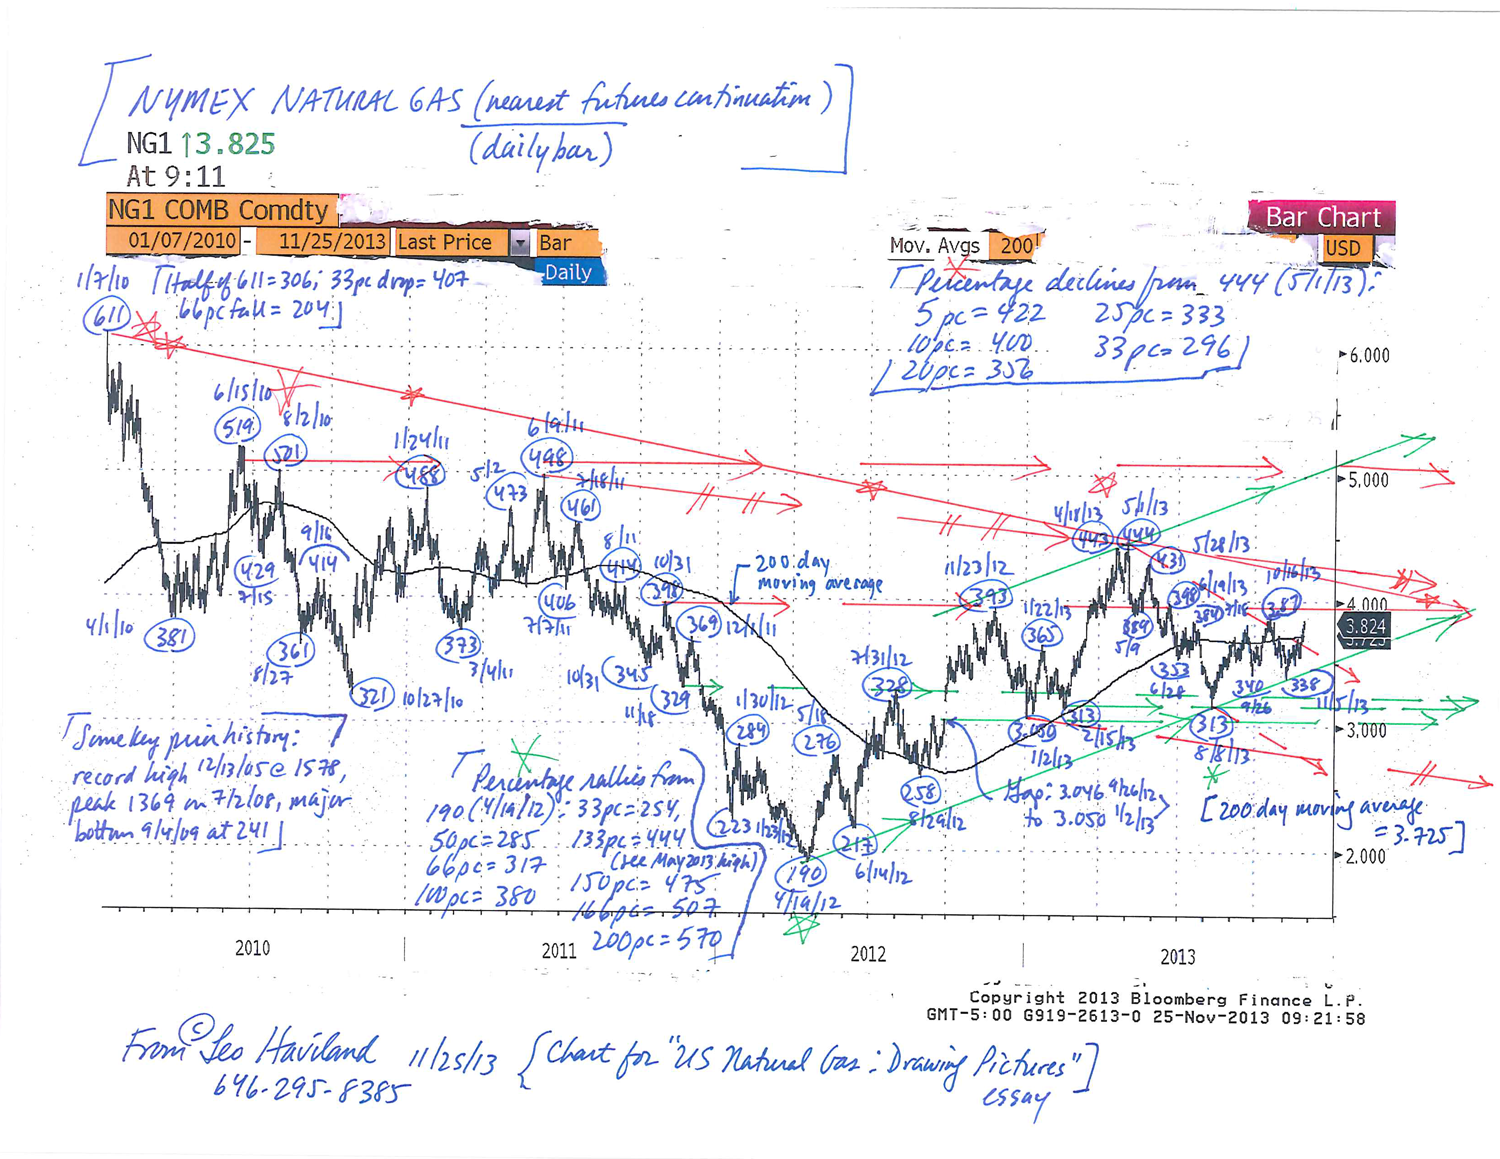
Over the winter 2013-14 time horizon, assuming normal weather and moderate American economic growth, the natural gas trend probably remains sideways (NYMEX nearest futures continuation). The broad range for natural gas stands from roughly 280/310 to 490/520. Many players view “around 350” as a near term equilibrium price. The 5/1/13 summit at 444 also represents important resistance.
What does the US lower 48 states working gas inventory picture unveil regarding potential price moves? Much depends on the perspective embraced regarding what constitutes average (appropriate, normal, reasonable, typical, usual) inventory levels. One factor in this regard is the historical time horizon selected. And although arithmetic inventory totals are important, observers especially should focus on the days of inventory coverage variable. After all, changing consumption levels influence industry viewpoints regarding what constitutes average, high, or low stockpiles.
Although the long run 1990-2012 vista should not be overlooked, suppose the 2006-12 horizon is more relevant for inventory analysis. Then end October 2013 natural gas inventories, despite being high in arithmetical (bcf) terms, arguably are slightly below average. Admittedly this conclusion probably is not a mainstream view. After all, most players and soothsayers devote their attention to arithmetic rather than days coverage history. In addition, assuming normal weather, natural gas stocks at the end winter 2013/14 draw season probably will be only slightly high relative to average in days coverage terms rather than moderately above average. Given this greater emphasis on the 2006-12 era, and despite the bearish supply/demand outlook for full year 2014, prices should hold above the 280/310 support band, with a test of 400 unsurprising.
With the 2006-present days coverage perspective in mind, given end build season 2013 inventories, what are price prospects if this winter is notably colder or warmer than average? A sustained move over 400 probably requires a somewhat colder than average winter (or widespread faith that such temperatures will occur). To challenge spring 2013’s top, probably a significantly colder than normal winter is necessary. But what if major inventory drawdowns in days coverage terms occur? The marketplace could climb toward and even briefly venture north of 490/520. Conversely, to sustain moves under the 280/310 floor, warmer than usual US temperatures in the key consumption regions must emerge and continue. Important support exists around the 305/310 first quarter 2013 level; note the 313 trough on 8/8/13 following the 5/1/13 peak.

FOLLOW THE LINK BELOW to download this market essay as a PDF file.
US Natural Gas- Drawing Pictures (11-25-13)
Natural Gas Chart (NYMEX nearest futures, for US Natural Gas- Drawing Pictures essay) (11-25-13)
When United States natural gas 2013 build season ends this autumn, inventories in the key Producing Region probably will be around 1200bcf, plus or minus five percent (1140bcf to 1260bcf range). Based upon historic inventory patterns, especially those of 2006 to the present, most marketplace participants probably would view around 1200bcf as average. Unlike build season 2012, the Producing Region will not confront notable containment issues this year.
Suppose a bear trend for NYMEX natural gas (nearest futures continuation) emerged from the recent highs over 440. One time to look for an important bottom is in late August/calendar September 2013.
Historical review of Producing Region inventory levels and trends alongside NYMEX natural gas price trends and levels reveals a rough pattern. Assume that gas prices establish an important peak. Although the history is relatively brief, there is a seasonal tendency for natural gas prices (NYMEX nearest futures continuation) to establish important bottoms sometime around late calendar August through calendar September and thus in the later stage of Producing Region (and US) build season. See the table above. Several of these lows were major trend change points.
This is a guideline, not a destiny.
FOLLOW THE LINK BELOW to download this market essay as a PDF file.
Natural Gas Inventory- the Producing Region Scenery (5-6-13)