GLOBAL ECONOMICS AND POLITICS
Leo Haviland provides clients with original, provocative, cutting-edge fundamental supply/demand and technical research on major financial marketplaces and trends. He also offers independent consulting and risk management advice.
Haviland’s expertise is macro. He focuses on the intertwining of equity, debt, currency, and commodity arenas, including the political players, regulatory approaches, social factors, and rhetoric that affect them. In a changing and dynamic global economy, Haviland’s mission remains constant – to give timely, value-added marketplace insights and foresights.
Leo Haviland has three decades of experience in the Wall Street trading environment. He has worked for Goldman Sachs, Sempra Energy Trading, and other institutions. In his research and sales career in stock, interest rate, foreign exchange, and commodity battlefields, he has dealt with numerous and diverse financial institutions and individuals. Haviland is a graduate of the University of Chicago (Phi Beta Kappa) and the Cornell Law School.
Subscribe to Leo Haviland’s BLOG to receive updates and new marketplace essays.

The classic American song “Home on the Range” requests:
“Oh give me a home where the buffalo roam,
Where the deer and the antelope play,
Where seldom is heard a discouraging word,
And the skies are not cloudy all day.”
****
CONCLUSION AND OVERVIEW
Did the major bull trend for NYMEX natural gas (nearest futures continuation) that started with 3/4/16’s dismal 1.611 depth finish with 12/28/16’s 3.994 top? Although it is a difficult call, assuming normal weather and moderate United States economic growth, it will be hard for the NYMEX front month price to exceed the high neighboring 4.00 by much (if at all) over the next few months. However, significant support rests around 2.50 (lows 8/12/16 at 2.523, 11/9/16 at 2.546, and 2/22/17 at 2.522; high 1/8/16 at 2.495).
The bull trends that began around first quarter 2012 (4/19/12’s 1.902) and during 1Q16 display many similarities, including their commencement following substantial oversupply conditions. Yet bearish signs exist in regard to the 2016 bull charge. The distance and duration travelled by 2016’s bull climb up to its December 2016 height, though less than average for major bull natural gas moves in NYMEX natural gas (nearest futures continuation), was within the historical range. Several previous major peaks in NYMEX natural gas occurred in calendar December. Current US natural gas inventories are above average. The CFTC’s net long commercial position is very high and consequently vulnerable to liquidation. And the 2012 rally showed an interim high in springtime (5/1/13 at 4.444).
As always, audiences should be cautious about linking natural gas price patterns with those in petroleum and other financial marketplaces. And apparent convergence/divergence (lead/lag) relationships between marketplaces can change, sometimes dramatically. However, these other playgrounds currently suggest that natural gas will struggle to advance above 12/28/16’s 3.994 anytime soon. See “The Oil Battlefield: Evolution, Relationships, and Prices” (4/10/17). Note also “Eurozone Under Siege: Currency Trends and Politics” (3/20/17), “Easing Comes, Easing Goes: US Government Interest Rates” (3/13/17), “Rhetoric and Global Currency Trends” (2/13/17), “Gold and Goldilocks: 2017 Marketplaces” (1/10/17), “Back to the Future: the Marketplace Time Machine” (12/13/16). Even the price gap from 3.568 (1/3/17) to 3.690 (12/30/16) represents a formidable near term roadblock.
However, what does looking further around the corner reveal? Everyone knows “much can happen” over the next six months and thereafter. Yet US natural gas days coverage at the end of inventory build season 2017 (October 2017) probably will be slightly bullish, with that (in the admittedly even cloudier distant horizon) at end build season 2018 more so. Thus an eventual retest of a ceiling around 4.00/4.10 is a reasonable conjecture. Looking ahead over the next several months, it probably will take a much colder than normal winter 2017-18 for the price to stay above 4.00/4.10 for long, and especially to spike above resistance at 4.45 to 4.55. Recall that winter 2013-14 required a freeze and resultant sharp stock draw to soar above the May 2013 and 12/23/13 (4.532) highs. Remember too the price collapse from 11/10/14’s 4.544.
FOLLOW THE LINK BELOW to download this article as a PDF file.
US Natural Gas- Home on the Range (4-15-17)
The lofty pinnacle created around 611 four years ago (1/7/10; NYMEX nearest futures continuation) is a distant memory for many marketplace visionaries. So are much higher price peaks prior to this. Especially since mid-2011, US natural gas production jumped due to the shale gas revolution as well as output associated with the petroleum drilling boom. This has built confidence that ample natural gas supplies generally will keep prices fairly subdued. Allegedly inevitable North American liquefied natural gas exports will not become sizable for at least another two or three years from now. Forecast US electricity demand for calendar 2014 is essentially flat relative to 2013. The NYMEX natural price (nearest futures continuation) even fell under two dollars two years ago (190 bottom; 4/19/12)! Recall the important resistance established this spring at 4.444 (on 5/1/13; challenged but not broken by the recent high on 12/13/13 at 4.443). So how on earth could the front month NYMEX price eventually (even if not this winter) ever sustain itself over 450, or even fly up to 500, 600, or even higher?
Yet inventory obviously still matters. History shows that weather can slash working gas inventories in the Producing Region and elsewhere, sometimes dramatically. Thus despite widespread faith in growing production and other supply/demand variables, high or even average national inventories, particularly from the days coverage perspective, are not guaranteed. Consequently if overall US inventories plummet far enough, and even if this is relatively unlikely (as of now) for winter 2013-14, five or six dollars (and yes, even higher) NYMEX prices are not inconceivable.
In addition, alternative “investment” in commodities has reduced the amount of “free supply” in natural gas. This buy-and-hold for the long run activity probably has been more of a factor since around 2003 (or at least 2006) than in the preceding time span. In any event, for any given arithmetical or days coverage gas inventory level nowadays, such investment makes stocks tighter than they appear, though experts can debate how much. “Speculative” buying enthusiasm also may rally prices.
FOLLOW THE LINK BELOW to download this market essay as a PDF file.
US Natural Gas Inventory- the Producing Region Drawing Board (12-16-13)
What is the outlook for United States natural gas prices (NYMEX nearest futures continuation)? Assume normal weather. From now through winter 2013-14, and probably for at least several months thereafter, the marketplace will be trapped in a sideways pattern.
From now through winter 2013-14, near term (on balance) bearish considerations and longer term (net) bullish ones intertwine to bottle up US natural gas prices. The American natural gas supply/demand situation from the production and consumption sides for the remainder of 2013 and calendar 2014 on balance is slightly bearish. Inventory days coverage becomes somewhat more bearish at end March 2014 relative to end October 2013. Natural gas demand from the key electric power sector arguably will not ascend much in the near term unless prices sustain dips under 350. Electricity demand for calendar 2014 grows very little year-on-year. To what extent will increasing supplies of energy from renewable sources put a lid on gas demand?
However, substantial US LNG exports represent a key bullish prospect for the relatively distant future. Coal plant retirements should underpin natural gas prices over the long run. The nation does not appear to be rushing to construct new nuclear power facilities. Although Mexico is currently a modest outlet for American gas exports, it is a growing one. Over the long run, what about demand for natural gas powered vehicles?
Recall spring 2013’s important highs just under 445 (4/18/13 at 443; 5/1/13 at 444) as well as the significant lows around 305 to 313 (305 on 1/2/13; 313 on 2/15/13 and 8/8/13). Between now and the close of winter 2013-14, the broad price range probably extends from roughly 280/310 to 440/460. Around 350 is a so-called equilibrium point within this price tunnel. It will take abnormal weather to provoke breaks of the extremes of this range during winter 2013-14, especially the high end (or beneath 280). Assuming this upcoming winter is neither unusually warm nor surprisingly cold, in general this price band probably will persist for at least a few months after winter departs. However, within the next several months, a test of the NYMEX nearest futures calendar 2013 lows around 305/313 is probable.
In any event, the long term price pattern for natural gas is sideways as well, though the top of the range probably extends to around 500/530 (or higher), with the amount of LNG exports, the extent of natural gas production increases at higher price levels (particularly at 400 and up), and the extent of US economic growth being crucial considerations.
Read the rest of this entry »
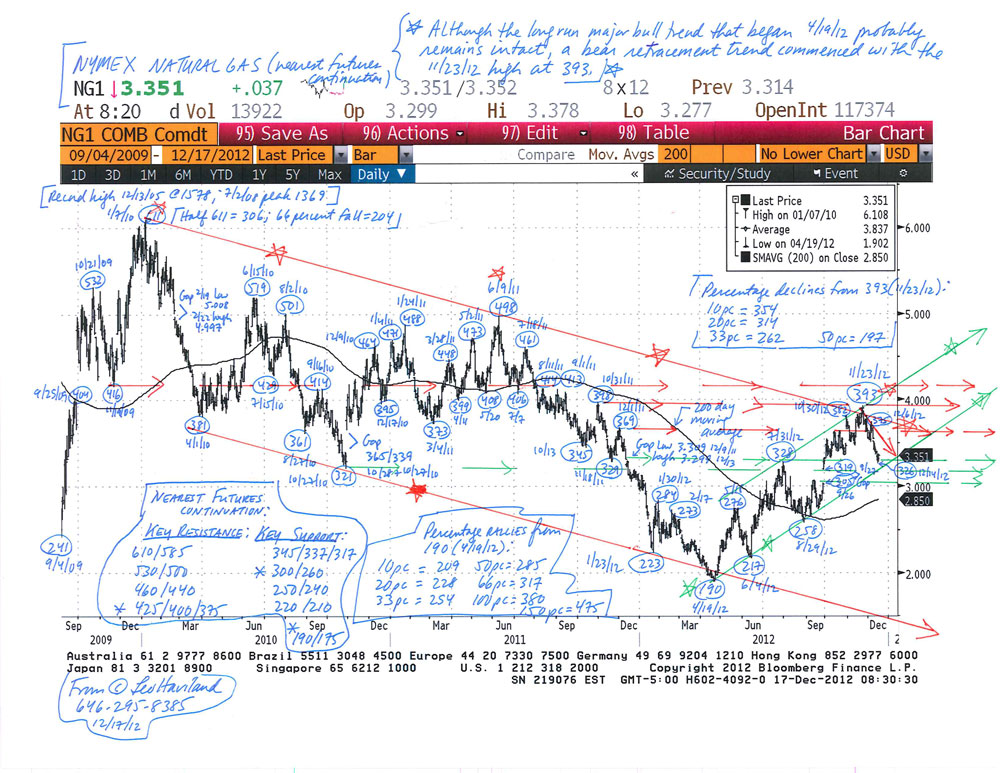
The current bear trend in US natural gas (NYMEX nearest futures continuation basis) that began in late November 2012 at 393 will continue. Assuming normal cold winter weather, the price probably will slump to around the 300 to 285 range. When will the price quit sledding downhill? Though it may only be an initial significant bottom, look for an important low in calendar January or February 2013, probably around futures expiration.
End October 2012 inventories were around 3923bcf according to the EIA barometer (Short-Term Energy Outlook, December 2012; “STEO”). Therefore end October’s 56.3 days of coverage rest about 2.6 days above the 53.7 day long run (1990-2011) average. Though not a big overload relative to that long run average, it is sufficient to place some burden on prices.
Moreover, look at the likely increasing relative oversupply in days coverage terms versus the 1990-2011 average for the given calendar month as time passes from end October 2012 to end March 2013. At end March 2013, forecast inventories of 1873bcf (December STEO, Table 5a) represent about 26.9 days coverage (1873bcf divided by 69.70bcf/d). This jumps about 4.7 days over the 22.2 day long run average for that month, more than October’s 2.6 days.
Suppose end March 2013 inventories are 1800bcf. The excess relative to the long run average is 3.6 days (25.8 less 22.2). This still hovers above the 2.6 day end October 2012 difference.
Despite the ongoing near term downtrend, and absent another very mild winter akin to 2011-12’s, a NYMEX natural gas price collapse close to the 190 abyss of April 2012 (or even the 1/23/12 and 6/14/12 depths near 220) is unlikely.
Based on 2012’s substantial switching from coal to natural gas, particularly in the electric power territory, natural gas demand probably will mount if prices sustain levels beneath (roughly) 275. In addition, another factor probably will mitigate price declines. Concentrate on days coverage holdings in recent years.
The desired level of natural gas inventory holding in recent years arguably has climbed relative to that long run average. Consequently the oversupply of October 2012 through March 2013 probably is less than many observers believe.

FOLLOW THE LINK BELOW to download this market essay as a PDF file.
US Natural Gas in Winter 2012-13- Drawing Conclusions (12-17-12)
Natural Gas Chart (NYMEX nearest futures) (12-17-12)