GLOBAL ECONOMICS AND POLITICS

Leo Haviland provides clients with original, provocative, cutting-edge fundamental supply/demand and technical research on major financial marketplaces and trends. He also offers independent consulting and risk management advice.

Haviland’s expertise is macro. He focuses on the intertwining of equity, debt, currency, and commodity arenas, including the political players, regulatory approaches, social factors, and rhetoric that affect them. In a changing and dynamic global economy, Haviland’s mission remains constant – to give timely, value-added marketplace insights and foresights.

Leo Haviland has three decades of experience in the Wall Street trading environment. He has worked for Goldman Sachs, Sempra Energy Trading, and other institutions. In his research and sales career in stock, interest rate, foreign exchange, and commodity battlefields, he has dealt with numerous and diverse financial institutions and individuals. Haviland is a graduate of the University of Chicago (Phi Beta Kappa) and the Cornell Law School.


Subscribe to Leo Haviland’s BLOG to receive updates and new marketplace essays.

RSS View Leo Haviland's LinkedIn profile View Leo Haviland’s profile


TWO-STEPPING: US GOVERNMENT SECURITIES © Leo Haviland December 1, 2015

In the film noir “Double Indemnity” (Billy Wilder, director), Walter Neff describes the murder tale as “Kind of a crazy story with a crazy twist to it.”

****

OVERVIEW AND CONCLUSION

Over the last seven years, through the last stage of the bloody worldwide economic crisis and the ensuing often fitful recovery, through dramatic and sometimes violent swings in assorted financial playgrounds, America’s heroic Federal Reserve ferociously has pinned the Federal Funds rate to the ground.

Many marketplace clairvoyants believe this widely-beloved guardian relatively soon will cautiously begin prodding the Funds rate higher. The next Fed gatherings are 12/15-16/15, 1/26-27/16, and 3/15-16/16. Maybe the courageous Fed will lift the rate up 25 basis points in its December 2015 meeting! In any case, as the widely-watched United States government two year note resides near the Fed Funds rate from the yield curve perspective, the two year US Treasury level and trend in part reflect marketplace opinions regarding Fed policy shifts and inflation.

In any case, the recent elevations in the two year US Treasury note a few basis points over .90 percent probably will not be broken by much in the near future. There indeed are some signs that United States inflation has edged toward the Fed’s two percent target. The Fed also proclaims its desire to normalize its highly accommodative policy. Yet the Fed embraces a gradual approach and does not want to make any missteps. Also, the international economy (look at the Eurozone and China) has slowed. So the Fed probably will patiently assess the consequences of its rate move for the United States (and global) economy and marketplaces (such as the S+P 500 and the US dollar).

****

Yield levels and relationships obviously can fluctuate for all sorts of reasons. However, the falling rate trend for the US 10 year government note since early 2014 contrasts with the rising one for the UST two year note. The drop in 10 year UST yields, as it is occurring in the face of some US inflation and rising two year rates and artful Fed pillow talk about normalizing policy, arguably reflects economic weakness (mediocre GDP growth) in the US or elsewhere. In today’s interconnected world, feebleness elsewhere influences the American scene.

Note a related warning signal of actual or impending US economic weakness consistent with the fall in 10 year UST yields. Since the advent of money printing in the US in late 2008/early 2009, narrowing of the 10 year less two year spread roughly has coincided with the ending of that quantitative easing. This spread tightening (becoming less positive) in turn has reflected slower economic growth (or worries regarding potential weakness or recession). The agile Fed announced the actual first round of “tapering” (gradual ending of its latest QE venture) on 12/13/13, after several reductions in the QE program, tapering finished at end October 2014. The Treasury spread currently is close to its July 2012 depth.

Is a hunt for yield, fearful flight to quality, or need to own high-grade collateral more focused on the long end of the US government yield curve than the short end? Perhaps, but not necessarily. As the ECB extends its money printing program, is a shortage of long dated Eurozone government debt not only pushing yields there lower, but also thereby reducing yields for the UST long term instruments such as the 10 year? Perhaps. But economic weakness remains the most convincing reason for the sustained decline in UST 10 year yields since early 2014.

Consistent with the fall in the US 10 year yield and the narrowing of the 10 year versus two year yield spread, additional flags indicating weakness for the worldwide economy beckon. Although the S+P 500 remains high, emerging marketplace stocks in general and commodities continue to join hands in long-running substantial bear trends. The durable bull trend in the broad real trade-weighted dollar generally has danced in tune with the bear ones in emerging marketplace stocks and commodities.

FOLLOW THE LINK BELOW to download this article as a PDF file.
Two-Stepping- US Government Securities (12-1-15)

AMERICA’S DEBT CULTURE © Leo Haviland April 6, 2015

America continues to have a love affair with debt. The nation has achieved remarkably little progress in improving its comprehensive (all-inclusive) debt situation since 2009’s very elevated debt relative to nominal GDP percentage. Increasing federal indebtedness has substantially though not entirely outweighed modest improvements in the consumer and state and local government domains. As the national government is a representative (democratic; “We, the People”) one, the country has not significantly mended its troubling overall debt problem.

A review of total American credit marketplace debt portrays the development and entrenchment of a national culture of debt. The long run trend toward greater debt holdings (and tolerance of debt) probably indicates and intertwines with a growing bias toward consumption and spending rather than saving. The increasing borrowing and massive debt accumulation arguably in part also probably reflect an increasingly widespread sense of entitlement to American Dream goals of the “good life” and a “better life”.
****

Total United States credit marketplace debt at end 2014 stood at about $58.7 trillion (Federal Reserve Board, “Financial Accounts of the United States”, Z.1 data; 3/12/15). The total includes US household, financial and non-financial business, and government debt, plus the relatively small foreign/rest of the world category. Compare 2001’s $29.2tr. Thus America’s credit marketplace debt has doubled in roughly a dozen years, and there has been no yearly fall in the sum since 2001.

What does a long run examination of total United States credit marketplace debt as a percent of nominal GDP reveal? Review the post-World War Two landscape. For over five decades, from the early 1950s up through the glorious Goldilocks Era that ended in 2007, and for a couple of years thereafter, total US indebtedness as a percentage of nominal GDP climbed steadily and substantially.

The bottom in overall US credit marketplace debt as a percent of GDP was 1951’s 129.5 percent. It inexorably edged up for about thirty years. It then started to accelerate from 1981’s 164.1pc. In 1985, it reached 200.3pc, with 1998’s 257.4pc, and 2001’s 275.1pc. In 2003, that measure attained 298.2pc. As debt became increasingly popular, it joyously soared during the blissful Goldilocks period to 346.1pc in 2007. As the gloomy American (and global) financial crisis emerged and proceeded, total US credit marketplace debt peaked at 362.0pc in 2009.

Despite pillow talk from many pundits about improving American debt conditions, that gigantic percentage has fallen only modestly since 2009. It slipped to 349.7pc of nominal GDP in 2010, and 340.6pc in 2012. However, it has diminished very little since then, with 2013 at 338.0pc and 2014 at 337.1pc. Significantly, 2014’s percentage remains not far from the heavenly Goldilocks Era 346.1pc height of 2007.

Another statistic further underscores the growth and persistence of America’s debt culture. Not only is the current credit marketplace debt as a percent of GDP level still historically high and close to the Goldilocks plateau. The arithmetic drop of 24.9 percentage points from the five years 2009 to 2014 (362.0pc less 337.1pc) is only about half the 47.9 point increase over the four years from 2003-07 (298.2 versus 346.1).
****

The Federal Reserve’s long-running extraordinary and very easy monetary policy (notably money printing/quantitative easing and interest rate yield repression) seek not only to ignite and sustain economic recovery and buy time for serious action in the federal and other debt realms. The Fed has battled to boost inflation to a supposedly sufficient level, while it has simultaneously repressed debt securities yields. Its artful strategies reflect the central bank’s ardent devotion on behalf of the constituency of debtors (borrowers) relative to the one of savers (creditors).

FOLLOW THE LINK BELOW to download this article as a PDF file.
America's Debt Culture (4-6-15)

AMERICA THE DEBTOR © Leo Haviland March 17, 2014

In recent weeks, much marketplace and media attention has underlined growing United States household net worth as well as decreasing household indebtedness as a percentage of GDP. Pundits proclaim that federal budget deficits have substantially declined from the towering heights of only a couple of years ago. Hasn’t the American and worldwide economy generally improved since the dreadful times of late 2008/early 2009? Americans point to the stratospheric rise of the S+P 500 since its March 2009 major low around 667. And look at those great US corporate earnings of the past couple of years! All such talk surely encourages optimism regarding the American financial situation, as has the related sustained highly accommodative monetary policy rhetoric and action of the Federal Reserve Board and its central banking comrades around the globe. Yet although Fed policies such as gargantuan money printing, severe interest rate repression, and fancy wordplay regarding forward guidance have boosted morale and purchased time for action on America’s major debt problem, they have not bought a solution to that issue.


To better perceive and assess America’s debt challenge, sentinels should adopt a wider perspective, focusing on the overall United States debt situation over a long historical period. For over five decades, from the early 1950s up through the glorious Goldilocks Era that ended in 2007, and for a couple of years thereafter, total US indebtedness as a percentage of nominal GDP climbed steadily and substantially.


Remarkably little progress has been made in the comprehensive (all-inclusive) US debt situation since 2009’s very lofty percentage. Increasing federal indebtedness has substantially though not entirely outweighed improvements in the consumer and state and local government sectors. Since the national government is a representative (democratic; “We, the People”) one, the general US debt situation has not mended significantly. In addition, although the federal budget deficits will remain relatively small (at least compared to the mammoth gaps of a few years ago), they gradually expand after the next few years. The ongoing substantial US debt mountain consequently remains a long run burden on, and probably also a near term problem for, US and international economic growth.


This review of total American credit marketplace debt portrays the development of a national culture of debt. The long run trend probably indicates a growing bias toward consumption and spending rather than saving. The increasing borrowing and massive debt accumulation arguably in part also probably reflect an increasingly widespread sense of entitlement to American Dream goals of the “good life” and a “better life”.

FOLLOW THE LINK BELOW to download this market essay as a PDF file.

America the Debtor (3-17-14)

THROWING CURVES: THE FRIENDLY FED’S YIELD CURVE GAME © Leo Haviland March 5, 2013

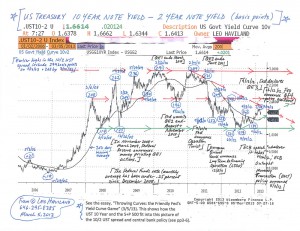
In professional sports such as baseball and Wall Street’s competitive marketplaces, history is not destiny. However, “the past” and variables apparently relevant to it need not be discarded as being of little or no importance, relevance, or guidance for current and future playgrounds. During the worldwide economic crisis that dawned in mid-2007 and the ensuing recovery, noteworthy moves in the 10 year less two year United States government yield spread often have roughly coincided with significant Federal Reserve Board policy decisions (and several months ago with major European Central Bank ones). These US Treasury yield curve ventures (trend changes) generally have occurred around the same time as significant moves in the US Treasury 10 year note and the US stock marketplace (S+P 500). Many lows in the 10/2 UST yield curve spread have tied up with (occurred within a few months of) important S+P 500 bottoms; pinnacles in the spread likewise link up somewhat closely in time with plateaus in the US stock playground.

The UST 10 year less two year spread probably established a major bottom on 7/24/12 at 117 basis points (10 year yield higher than two year return, so a positive yield curve; short rates over long rates creates a negative yield curve).

What would a further notable widening of the spread (steepening of the curve, more positive slope) from current heights around 165 basis points suggest to avid financial marketplace fans? Perhaps a sustained move in this 10/2 UST spread over around 200 to 210 basis points will indicate a renewed (further) strengthening of the US (and worldwide) economic recovery.

However, that upward path over 200/210 basis points instead may warn of impending economic weakness. This viewpoint is not necessarily as off base as some may claim. One needs to focus on whether America is a key source of and significant spark for likely global (not just US) feebleness.

In that regard, recall the shift from 6/12/08’s 117 basis point low (same as 7/24/12’s) up to 11/13/ 08’s 262bp as the financial crisis raced forward (Lehman Brothers bankruptcy 9/15/08). The US housing and financial leverage (banking system) problems were critical issues (though of course not confined to the US), even though the US (and the world in general) did not in mid-2008 yet face major fiscal troubles.

Why might the 10/2 UST spread widen (as in mid-June to mid-November 2008) nowadays or in the near or medium term? In some circumstances, there can be a dismal widening of the UST spread (and higher long term rates) accompanied by little or no economic growth (or even a recession). Suppose the current US (and international) economic horizon darkened significantly. Assume a big fiscal difficulty in the US is a major factor in this bleak outlook. Then maybe this time around, when economic downturn risks in general still loom large, there will not be as nearly as substantial a flight to quality into UST as there was at end 2008 (after mid-November) and as there has been at subsequent economic (downturn) crisis periods since then up to the present time. Thus this setup probably would produce an outcome for the 10/2 yield spread very unlike its pattern during the previous substantial financial deteriorations of the mid-November 2008 to the present time span. Many players (especially international ones) may not view the UST as wonderful quality (especially when nominal yields are so mediocre) if the US may or does become the star of a fearsome fiscal problem and related systemic economic crisis.

Yet the history of the past several years also warns that a slump in the 10/2 UST spread back close to around the July 2012 bottom probably signals US (and global) economic weakness as well.
US-Treasury-10-Year-versus-2-Year-Note-Chart-(3-5-13)
FOLLOW THE LINK BELOW to download this market essay as a PDF file.
Throwing Curves- the Friendly Fed’s Yield Curve Game (3-5-13)
US Treasury 10 Year versus 2 Year Note Chart (3-5-13)