THROWING CURVES: THE FRIENDLY FED’S YIELD CURVE GAME © Leo Haviland March 5, 2013
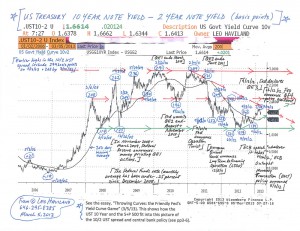
In professional sports such as baseball and Wall Street’s competitive marketplaces, history is not destiny. However, “the past” and variables apparently relevant to it need not be discarded as being of little or no importance, relevance, or guidance for current and future playgrounds. During the worldwide economic crisis that dawned in mid-2007 and the ensuing recovery, noteworthy moves in the 10 year less two year United States government yield spread often have roughly coincided with significant Federal Reserve Board policy decisions (and several months ago with major European Central Bank ones). These US Treasury yield curve ventures (trend changes) generally have occurred around the same time as significant moves in the US Treasury 10 year note and the US stock marketplace (S+P 500). Many lows in the 10/2 UST yield curve spread have tied up with (occurred within a few months of) important S+P 500 bottoms; pinnacles in the spread likewise link up somewhat closely in time with plateaus in the US stock playground.
The UST 10 year less two year spread probably established a major bottom on 7/24/12 at 117 basis points (10 year yield higher than two year return, so a positive yield curve; short rates over long rates creates a negative yield curve).
What would a further notable widening of the spread (steepening of the curve, more positive slope) from current heights around 165 basis points suggest to avid financial marketplace fans? Perhaps a sustained move in this 10/2 UST spread over around 200 to 210 basis points will indicate a renewed (further) strengthening of the US (and worldwide) economic recovery.
However, that upward path over 200/210 basis points instead may warn of impending economic weakness. This viewpoint is not necessarily as off base as some may claim. One needs to focus on whether America is a key source of and significant spark for likely global (not just US) feebleness.
In that regard, recall the shift from 6/12/08’s 117 basis point low (same as 7/24/12’s) up to 11/13/ 08’s 262bp as the financial crisis raced forward (Lehman Brothers bankruptcy 9/15/08). The US housing and financial leverage (banking system) problems were critical issues (though of course not confined to the US), even though the US (and the world in general) did not in mid-2008 yet face major fiscal troubles.
Why might the 10/2 UST spread widen (as in mid-June to mid-November 2008) nowadays or in the near or medium term? In some circumstances, there can be a dismal widening of the UST spread (and higher long term rates) accompanied by little or no economic growth (or even a recession). Suppose the current US (and international) economic horizon darkened significantly. Assume a big fiscal difficulty in the US is a major factor in this bleak outlook. Then maybe this time around, when economic downturn risks in general still loom large, there will not be as nearly as substantial a flight to quality into UST as there was at end 2008 (after mid-November) and as there has been at subsequent economic (downturn) crisis periods since then up to the present time. Thus this setup probably would produce an outcome for the 10/2 yield spread very unlike its pattern during the previous substantial financial deteriorations of the mid-November 2008 to the present time span. Many players (especially international ones) may not view the UST as wonderful quality (especially when nominal yields are so mediocre) if the US may or does become the star of a fearsome fiscal problem and related systemic economic crisis.
Yet the history of the past several years also warns that a slump in the 10/2 UST spread back close to around the July 2012 bottom probably signals US (and global) economic weakness as well.

FOLLOW THE LINK BELOW to download this market essay as a PDF file.
Throwing Curves- the Friendly Fed’s Yield Curve Game (3-5-13)
US Treasury 10 Year versus 2 Year Note Chart (3-5-13)


