


SEEKING DIRECTIONS: US DOLLAR RETREATS, ADVANCES, AND RELATIONSHIPS (c) Leo Haviland June 14, 2013
The broad real trade-weighted United States dollar (TWD) not only will remain relatively weak, but also it probably will test its July 2011 bottom around 80.5 in the relatively near future.
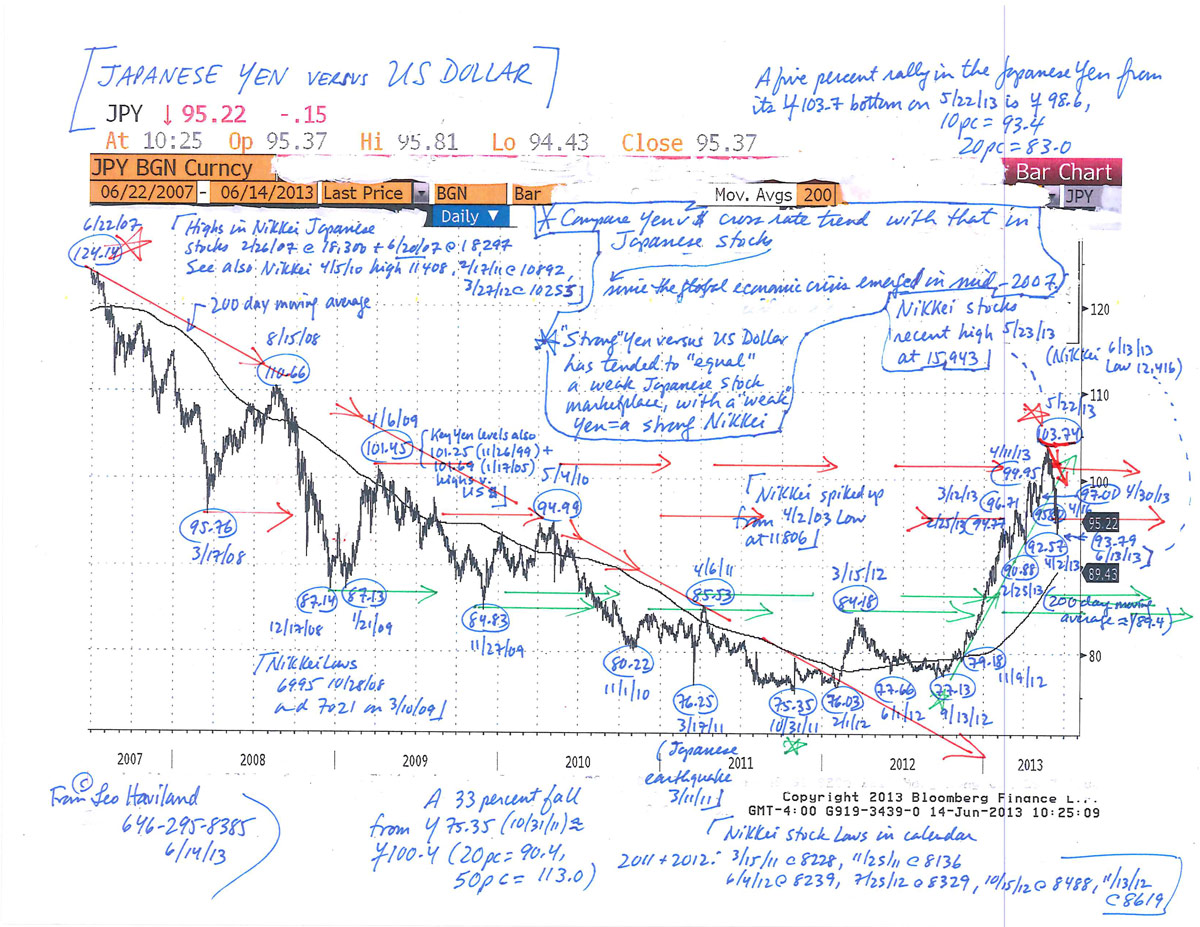
Within and between currency, interest rate, stock, and commodity domains, observers debate marketplace intertwining, convergence/divergence, and lead/lag relationships and issues. In any event, since the economic crisis walked onto the world stage in mid-2007, and especially after its acceleration during 2008, many marketplace gurus ardently have promoted the guideline that a “weak US dollar equals strong US (and many other) stock marketplaces, strong dollar equals weak US stocks”. This beloved relationship probably no longer holds. In the current theater, the weak US dollar (and any further deterioration in it) now probably translates into falling American stock marketplace prices (use the S+P 500 as a benchmark). In addition, a still-relatively weak TWD (one not sustaining a venture much above its June 2012 peak at 86.3) will not bolster equities much if at all.
In recent months, and especially in the past several weeks, US dollar cross rates have displayed competing perspectives regarding dollar strength. Thus the dollar sometimes appears to be walking a tightrope. The US dollar has rallied recently against the currencies of many developing (and some rather developed) nations and assorted emerging marketplace nations. Several of these domains represent key commodity producers. However, the US dollar has eroded in recent weeks against the currencies of several of its major trading partners such as the Japanese Yen and Euro FX. The dollar remains relatively feeble against the Chinese renminbi as well. This weakness in these key crosses underlines not only the current weakness in the TWD, but also warns that the TWD is quite vulnerable to renewed declines. Moreover, falls of the US dollar in these key crosses (as does the weakness in the TWD in general) indicate that further declines in the US stock marketplace loom ahead (despite the Federal Reserve’s longstanding accommodative policies.
This viewpoint on intertwined US dollar and US equity weakness fits the stories of the dive in emerging marketplace equities (which began in 4/27/11; the “MSCI emerging stock markets index”/MXEF at 1212) and the fall in commodity prices (broad Goldman Sachs Commodity Index’s major downtrend commenced in spring 2011 with the 4/11 and 5/2/11 highs at 762), as well as the bear trend in US government notes. Yields for the 10 year UST bottomed 7/25/12 around 1.38pc; they established other important floors at 1.55pc (11/16/12) and 1.61pc (5/1/13). Note the fall in the MXEF from its 5/9/13 high around 1065 alongside the rise in US rates (especially from the 5/1/13 depth) in the context of the slump in many emerging/developing/commodity producing marketplace cross rates versus the dollar. Keep in mind the timing links (similar directional moves) in recent years between the MXEF and the S+P 500 (even though the S+P 500 climbed to new highs after spring 2011). The renewed faltering in emerging stock marketplaces in recent weeks warns of a notable fall in the S+P 500.
The S+P 500’s high on 5/22/13 near 1687 probably represents (or is very close to) a very significant high.
FOLLOW THE LINK BELOW to download this market essay as a PDF file.
Seeking Directions- US Dollar Retreats, Advances, and Relationships (6-14-13)
Japanese Yen versus US Dollar Chart (6-14-13)