

GLOBAL ECONOMICS AND POLITICS

Leo Haviland provides clients with original, provocative, cutting-edge fundamental supply/demand and technical research on major financial marketplaces and trends. He also offers independent consulting and risk management advice.

Haviland’s expertise is macro. He focuses on the intertwining of equity, debt, currency, and commodity arenas, including the political players, regulatory approaches, social factors, and rhetoric that affect them. In a changing and dynamic global economy, Haviland’s mission remains constant – to give timely, value-added marketplace insights and foresights.

Leo Haviland has three decades of experience in the Wall Street trading environment. He has worked for Goldman Sachs, Sempra Energy Trading, and other institutions. In his research and sales career in stock, interest rate, foreign exchange, and commodity battlefields, he has dealt with numerous and diverse financial institutions and individuals. Haviland is a graduate of the University of Chicago (Phi Beta Kappa) and the Cornell Law School.


Subscribe to Leo Haviland’s BLOG to receive updates and new marketplace essays.

RSS View Leo Haviland's LinkedIn profile View Leo Haviland’s profile



US NATURAL GAS: CAUGHT IN THE MIDDLE © Leo Haviland February 1, 2016

“So much trouble in the world…
The way earthly thin’s are goin’
Anything can happen”. Bob Marley and the Wailers, “So Much Trouble in the World”

 ****

CONCLUSION AND OVERVIEW

In economics, politics, and other cultural fields, players create a variety of competing perspectives. They select between and arrange a variety of diverse variables to produce their arguments and conclusions. In commodity, currency, interest rate, and stock marketplaces, bulls and bears therefore tell a variety of contending stories. In natural gas as in other marketplace battlegrounds, an array of speakers creates assorted viewpoints fighting to attract attention and persuade eager audiences.

****


“Dangerous Times in US Natural Gas” (11/2/15) concluded: “The probable range for the United States natural gas marketplace (NYMEX nearest futures continuation basis) for the next several months is a relatively broad avenue between major support at 1.65/1.90 and significant resistance at 3.10/3.45.” The NYMEX natural gas major bear trend that followed 2/24/14’s major peak at 6.493 smashed through 4/27/15’s 2.443 minor low, 10/27/15’s 1.948 interim low, and the last prior major bottom (1.902 on 4/19/12), crashing to 1.684 on 12/18/15. Assuming normal weather for the balance of winter 2015-16 and spring/summer 2016, this range probably will persist for the next several months as well.

The high since December 2015’s low is 1/8/16’s 2.495. What would enable US natural gas prices (nearest futures) to sustain travels over 3.00? It probably will require significantly colder temperatures for the balance of winter, a blazing spring and summer, or (and especially) noteworthy cuts in natural gas production. Stronger than expected US (and global) economic growth would help rally natural gas prices. A major bull move in commodities “in general” (and especially in the petroleum complex) and a significant reversal of the major bull move in the broad real trade-weighted US dollar to some extent would assist a bull move in natural gas.

However, a somewhat significant containment risk (supplies too high relative to available storage capacity), nevertheless exists for US natural gas around the end of calendar 2016 build season. If containment fears grow stronger, and especially if actual problems develop, the 1.65 floor could be broken. In addition, US economic weakness (especially if accompanied by similar slumps around the globe), renewed feebleness in commodities (particularly in the petroleum world), and a continued strong trade-weighted US dollar would help to keep US natural gas prices under pressure.

****

Historical analysis indicates the major bear trend in US natural gas from February 2014 to December 2015 voyaged sufficiently far in price and duration terms to conclude that a trend shift from bearish to sideways occurred with December 2015’s low. However, the dramatic February 2014 to October 2015 price tumble is not the greatest or longest on record. So a further descent in NYMEX natural gas would not be unprecedented.

Anticipated end March 2016 gas inventories probably will be high in both arithmetic (bcf) and days coverage terms, a bearish consideration. However, based upon US Energy Information Administration (EIA) anticipated end October 2016’s 52.1 days coverage level slides 3.4 days beneath the 2006-15 end October average of 55.5 days and 1.5 days under 1990-2015’s 53.6 days.

Nevertheless, modest days coverage levels for October 2016 does not eliminate a containment danger; one should focus closely on arithmetic levels. The days coverage perspective of course does not provide a complete viewpoint on the natural gas inventory situation and related price risks. After all, arithmetic quantities (bcf) of gas must be put in arithmetic storage places. Especially if little new natural gas storage capacity has been (and is being) created, containment problems could emerge around the end of the 2016 inventory build season (roughly around end October 2016). And currently, the containment risks for the end of build season 2016 are not insubstantial; this bearish potentiality weighs on prices.

Yet sustained low natural gas prices could reduce production more than some soothsayers forecast. This would help reduce containment risks. Note the big drop in US natural gas rig counts. A sustained slump back under 2.00 might boost electric power switching from coal to gas.

Everyone knows that much can happen between now and 2017, whether in natural gas or elsewhere. Yet based upon the EIA’s bcf prediction, natural gas days coverage at end October 2017 probably will be less than average, a bullish factor. And the EIA’s bcf arithmetic inventory forecast for end October 2017 implies there probably will not be a containment problem around the end of build season 2017.

****

Natural gas prices often travel substantially independently of both petroleum (and commodities “in general”) and so-called “international” or “financial” marketplaces and variables. Trend changes in NYMEX natural gas need not roughly coincide with one in the petroleum complex or commodities in general, or currency, stock, or interest rate playgrounds.

However, especially since mid-to-late June 2014 (NYMEX natural gas nearest futures interim high 6/16/14 at 4.886) and into calendar 2015 (gas interim top 5/19/15 at 3.105), bearish natural gas price movements intertwined with those in the petroleum complex (and commodities in general) and the bull move in the broad real trade-weighted US dollar. Such natural gas retreats to some extent paralleled slumps in emerging marketplace stocks. Note also the timing coincidence between May 2015’s natural gas top and the S+P 500’s 5/20/15 peak at 2135. In regard to the timing of the S+P 500’s May 2015 high, note that the nominal broad trade-weighted dollar (Federal Reserve, H.10, which has daily data) made an interim low at 112.8 on 5/15/15 before appreciating further.

See “The Curtain Rises: 2016 Marketplace Theaters” (1/4/16), “Japanese Yen: Currency Adventures (2007-09 Revisited)” (1/14/16), “Commodities: Captivating Audiences” (10/12/15), and various related essays.

Natural gas prices indeed can trade “on their own”. But suppose a sustained bull move finally appeared in commodities “in general” (especially petroleum). Worldwide OECD industry and United States petroleum stocks are very elevated. OPEC next meets 6/2/16. It remains determined to capture market share and induce output cutbacks by high-cost oil producers around the world (including some American and Canadian ones). But is crude oil under 30 dollars a barrel “irrational”? The chairman of Saudi Arabia’s state oil company, Aramco said: “’The market has overshot on the low side and it is inevitable that it will start turning up’”, predicting higher prices by the end of the year.” (Financial Times, 1/22/16, p20). Will OPEC reach agreement with non-OPEC nations such as Russia to boost prices? Might OPEC hold an emergency meeting?

Key global central banks battle to ensure economic growth, create sufficient inflation (avoid deflation), and reduce unemployment. The European Central Bank recently suggested it might ease its already highly accommodative policies further (ECB Statement and Press Conference, 1/21/16). The Bank of Japan recently (1/29/16) eased its lax monetary policy even further, adopting negative interest rates. Will the Federal Reserve delay additional interest rate increases?

The Fed and its allies probably do not want the S+P 500 and related stock marketplaces to crash under their January 2016 lows. They also probably do not want the dollar’s bull move to extend much (if at all) beyond its January 2016 high. The US dollar’s major bull trend has been long and powerful. From its July 2011 major low around 80.5 to the recent January 2016 high at 101.2, the broad real trade-weighted dollar has climbed 25.8 percent (Federal Reserve, H.10; monthly average). What will happen to natural gas prices if the S+P 500 (and emerging marketplace stocks “in general”) rallied substantially? What if the US broad real trade-weighted dollar weakens notably (even if it remains relatively strong)?

FOLLOW THE LINK BELOW to download this article as a PDF file.
US Natural Gas- Caught in the Middle (2-1-16)
NEGATIVE CREEP: THE GLOBAL ECONOMY © Leo Haviland February 2, 2015

The European Central Bank’s magnificent march into full-scale quantitative easing captivates cheerleaders hoping for significant European (and worldwide) economic growth, a decisive defeat of the evil deflationary dragon, and further bullish ascents in stock marketplaces such as the S+P 500. Prior massive money printing, especially but not only by the Federal Reserve, engendered optimism, enhanced near-term economic growth, and helped to propel many equity benchmarks (notably the S+P 500) upward. So given the ECB’s bold policy announcement on 1/22/15, shouldn’t we all be rather positive about global (and Eurozone) economic prospects? No.

Of course the ECB’s decision to begin devouring “euro-denominated investment-grade securities issued by euro area governments and agencies and European institutions in the secondary market” is only one variable. But despite that central bank’s long-hoped for purchasing scheme, adequate Eurozone GDP growth still appears out of reach, and overall international economic prospects look less robust than they seemed only a few months ago. In addition, despite the ECB’s dramatic policy intervention, key government securities yields show little signs of climbing. This holds true not merely for Germany, but also the United States and Japan. Plus the broad real trade-weighted United States dollar remains relatively strong, nearing critical points achieved in mid-2008 during the global financial disaster. After their massive tumble in recent months, commodities in general (use the broad Goldman Sachs Commodity Index as a benchmark) remain well beneath their June 2014 (and previous) heights.

Yet at least shouldn’t the ECB’s big easing at least manage to rally key stock arenas, and especially to push the S+P 500 above its December 2014 summit? Recall what happened to the S+P 500 after the Federal Reserve unveiled its quantitative easing rounds, or what occurred after Japan introduced “Abenomics” and Quantitative and Qualitative Easing!

However, the S+P 500’s inability thus far to creep up to new bull trend highs beyond its 12/29/14 summit at 2094 contrasts with its prior behavior after the Fed’s QE programs. Again, keep in mind recent yield patterns of key government yield signposts such as the US and German 10 year notes, as well as the stronger dollar and weaker commodities. Also, emerging stock marketplaces in general, with various twists and turns, gradually have sagged lower since their spring 2011 high. So although admittedly not much time has passed since the ECB’s December action, these interrelated factors and slipping world growth prospects indicate that the ECB’s new policy probably will not produce the hoped-for rally in the S+P 500 and related stock playgrounds. These present-day marketplace variables, especially when interpreted alongside their history during the mournful 2007-09 global economic crisis, instead suggest that a notable S+P 500 downtrend is or soon will be underway. And in today’s environment, what happens to American stocks if overall US corporate earnings slow or move into reverse?

FOLLOW THE LINK BELOW to download this article as a PDF file.
Negative Creep- the Global Economy (2-2-15)

THE CENTRAL BANK EASY MONEY GAME: TAKING CREDIT, STRAINING CREDIBILITY (c) Leo Haviland, July 8, 2013

The Federal Reserve Board continues to stress via its wonderful forward guidance strategy that it will keep policy rates extremely low. However, the sustained rally in United States Treasury government yields shows that marketplace confidence in the Fed’s ability to manage (repress) interest rates, especially at the long end of the yield curve, has fallen. Look at the UST 10 year note. Not only did its yield bottom around 1.38 percent on 7/25/12. Not only did yields climb further from lows near 1.55pc (11/16/12 and 12/6/12). They have spiked from 5/1/13’s 1.61pc, touching 2.75pc 7/8/13. And this spike has continued even after the Fed underlined in recent weeks that it would not “taper” its money printing (and other easy money games) too quickly.

The ability of central bank maneuvers to sustain substantial economic growth (and repress government yields and rally the S+P 500 and related equities) probably has weakened.

Rising sovereign debt yields do not always reflect or portend economic growth (recovery) or higher stock marketplace prices. In the current marketplace playing field, rising interest rates in America (and elsewhere) also seem to be “leading” equity marketplace declines. Suppose the US government 10 year rate marches higher from current levels (or even if it stays relatively high versus its summer 2012 and May 2013 bottoms). Suppose the S+P 500 is unable to exceed (or break much above) its May 2013 height and that it declines beneath its late June 2013 low around 1560. The rising yields and falling equities will underscore that the easy money game of the Fed and its central banking allies increasingly strains credibility and thus has diminished substantially in its effectiveness.

In any event, it nevertheless stretches credibility to claim that these recent ECB and BoE statements represent a change of genuine significance. They appear to be clever ploys to boost confidence in the ability of the central banks to help guide and sustain recovery. How likely was (is) it that the ECB or the BoE were (are) going to raise rates anytime soon? Not only is much of Europe in recession, but Europe’s economic crisis (including sovereign and banking debt and related bailout issues) persists. Noteworthy troubles still loom in Greece, Ireland, Portugal, Cyprus, as well as in Spain and arguably in Italy. Moreover, recall the ECB President’s inspiring “whatever it takes” talk about a year ago (7/26/12); people gave substantial credence to that open-ended proclamation.

Consequently, these recent ECB and BoE remarks, like the cheerleading comments by Federal Reserve and Chinese officials after the June 2013 stock marketplace lows, look like a sign of weakness. Are the ECB and BoE losing some of their hold on the distant section of the yield curve? Yes. Again underscore the steady creep higher in longer run government rates in the United States (and many other arenas) despite keeping Federal Funds near the ground.
Read the rest of this entry »

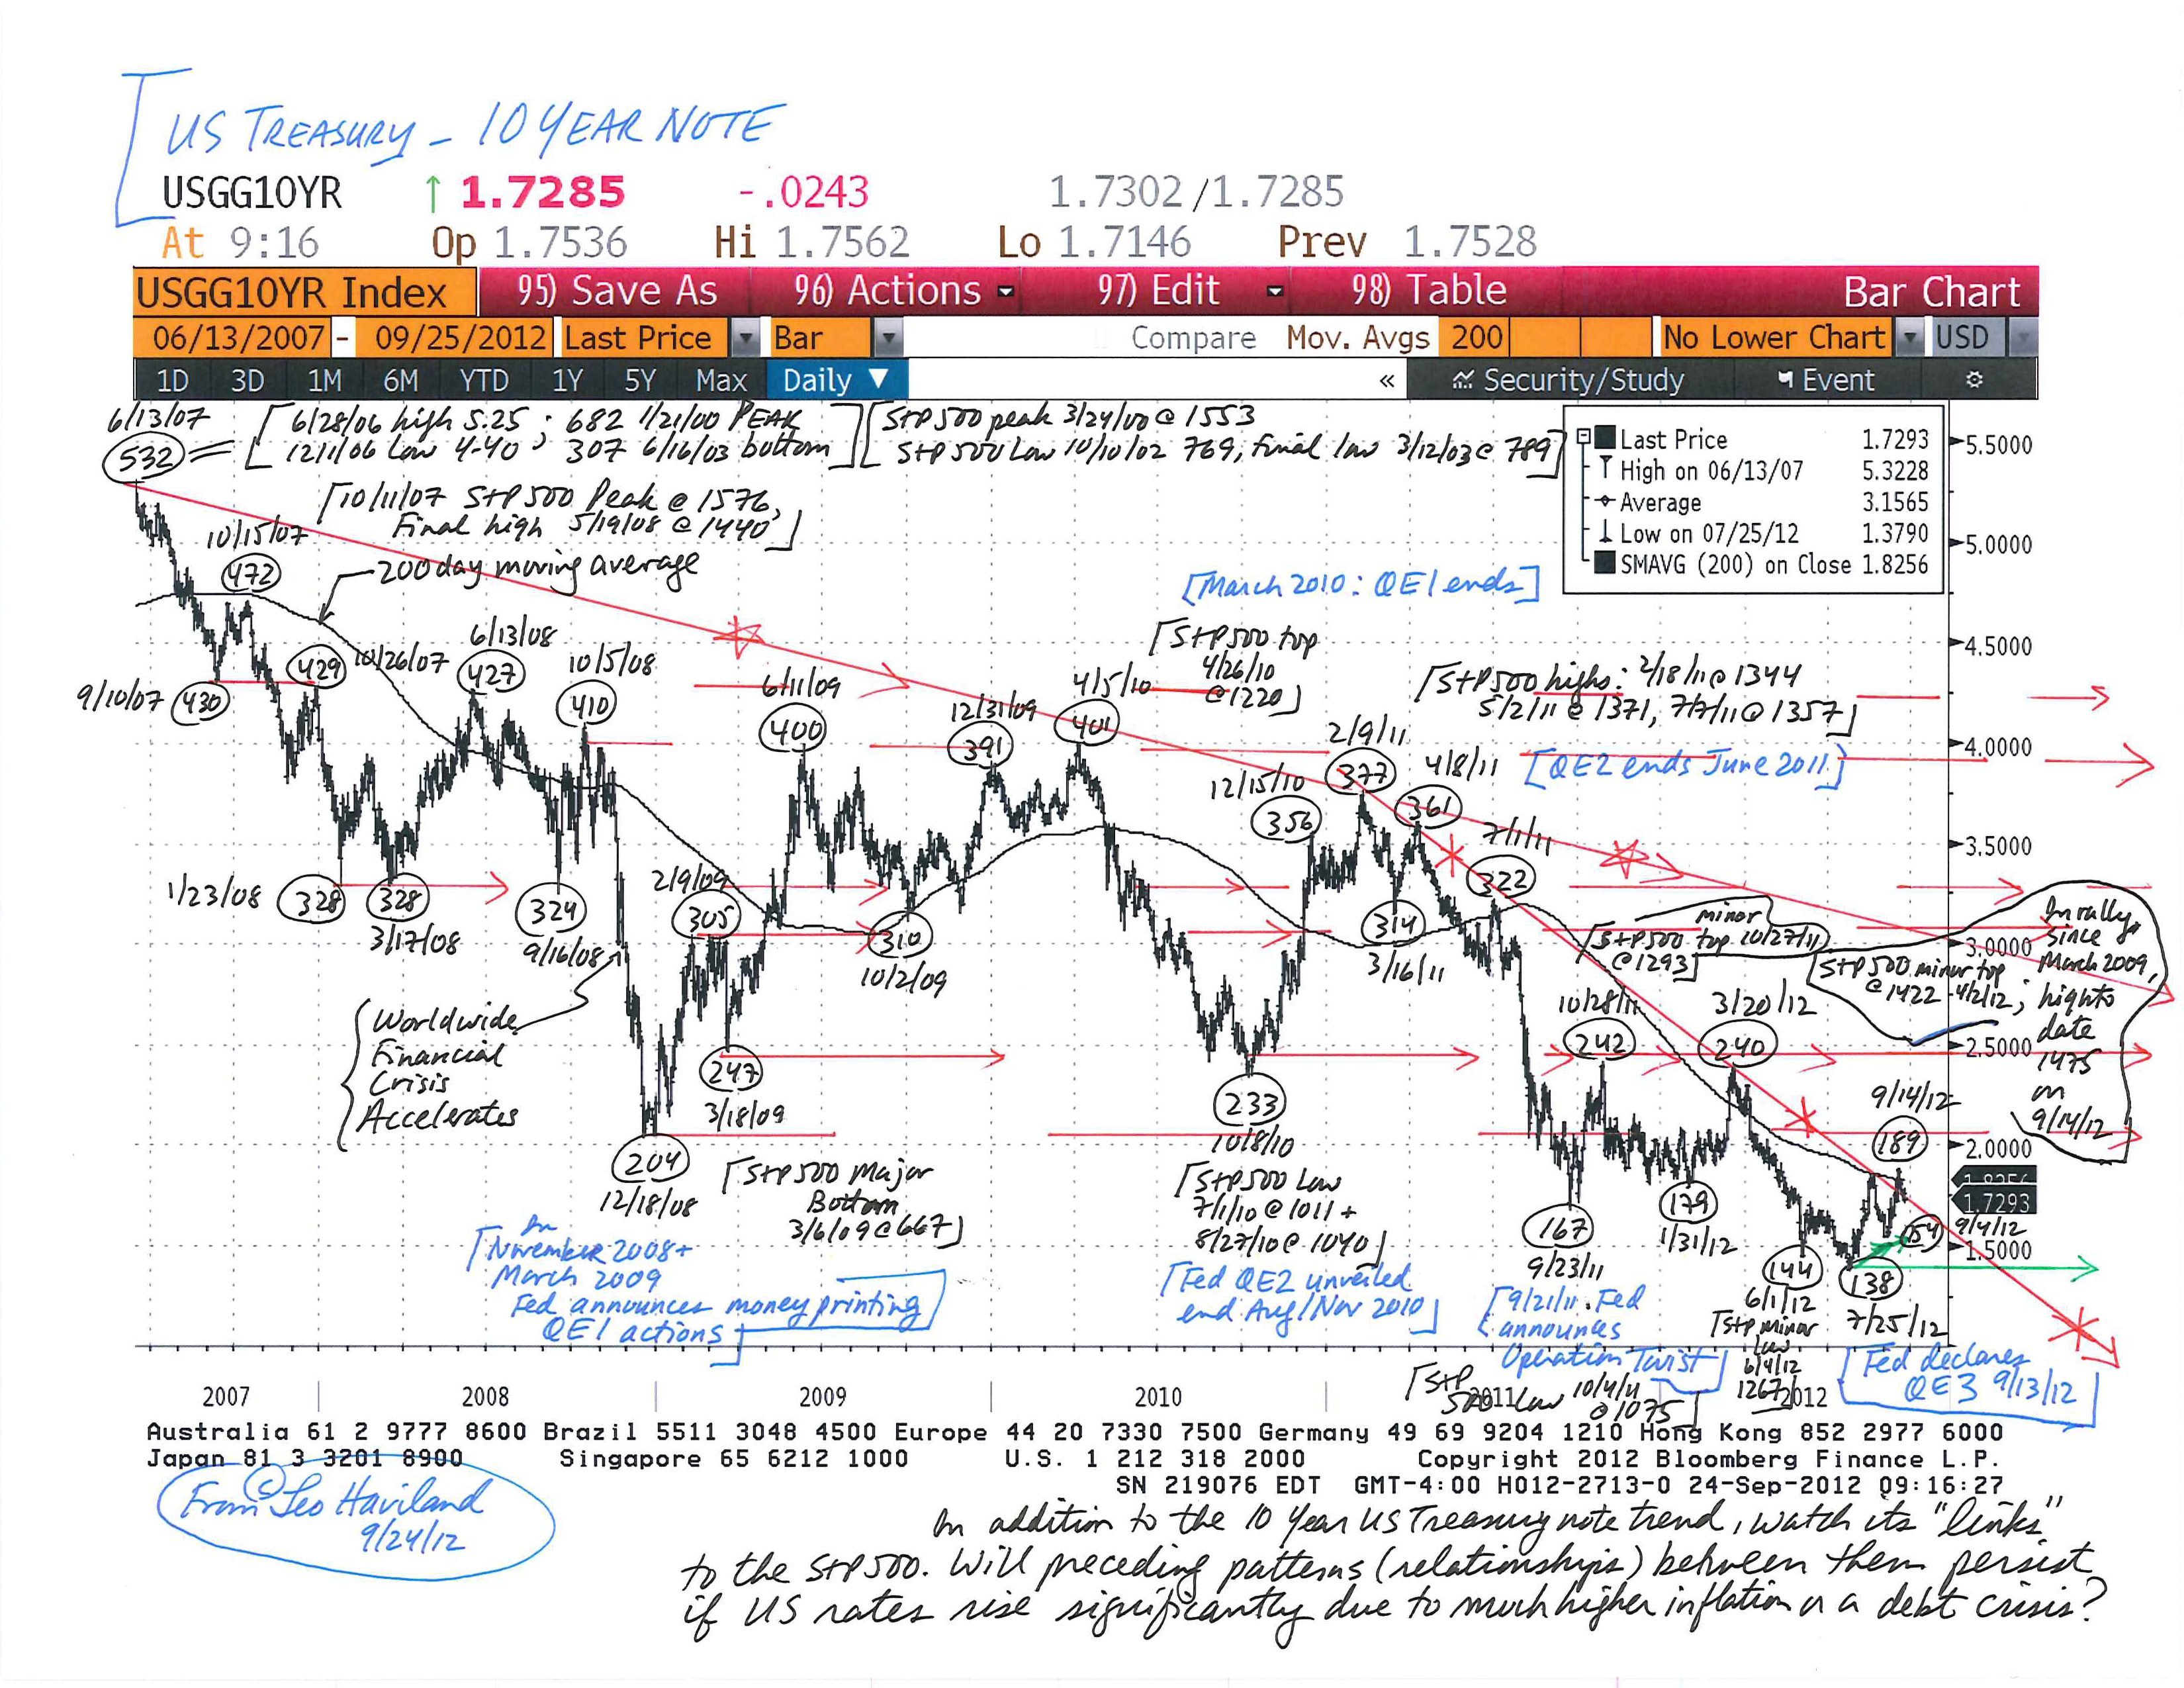
FED FIXATIONS: INTEREST RATES © Leo Haviland September 24, 2012

A key United States interest rate benchmark, the 10 year Treasury note, probably established a major bottom around 1.40 percent in late July 2012.

The Federal Reserve Board’s fixing of the Federal Funds rate at exceptionally low levels admittedly restrains ascents in US government yields. Its benevolent promise and determination to maintain the Funds rate almost flat on the ground until at least mid-2015 encourages faith that government yields generally will remain depressed. Also, heightened flight to quality fears and nervous leaps in recessionary worries may push the 10 year UST challenge back toward or even slightly beneath its July low. The Eurozone crisis, for example, has not disappeared. America’s 2013 federal “fiscal cliff” looms large on the horizon.

However, all else equal, a flood of money printing tends to increase inflation and thus interest rates. And all else equal, cracking or crumbling creditworthiness for a borrower- whether an individual, corporation, or government- tends to boost the interest rate charged that borrower. America nowadays confronts another round of Federal Reserve money printing and has made little headway in resolving its awesome fiscal problems.

The Federal Reserve’s long rumored (fervently hoped for) and recently decreed (9/13/12) third cascade of money printing, QE3, probably will be massive, perhaps over one trillion dollars. Over time, this deluge will help to boost US government (and other) interest rates.

Moreover, given a generous desire to avoid the fiscal cliff and a downturn, Congress probably will continue its huge deficit spending spree. Not only has America become habituated to deficit spending, debt (including personal debt), and assorted forms of entitlement. How many people volunteer nowadays to pay sufficiently more taxes to solve- or at least significantly reduce- near term (as well as long run) national fiscal troubles? For a debtor nation such as America, running substantial budget deficits alongside elevated (and thus expanding) government debt as a percentage of nominal GDP raises the risk of a severe fiscal trial. The arrival of this crisis probably will occur relatively soon rather than at some vague date many years down the road. In any event, this visit will tend to raise US government rates. The US may be an economic fortress, but that does not guarantee that its creditworthiness will be unquestioned or unchallenged. Witness Europe in recent years; also recollect the debt sagas of many emerging marketplaces.

What are key levels for the US Treasury 10 year note? Start at the low end and walk higher.

FOLLOW THE LINK BELOW to download this market essay as a PDF file.
Fed Fixations- Interest Rates (9-24-12)
US Treasury 10 Year Note Chart (9-24-12)