GLOBAL ECONOMICS AND POLITICS

Leo Haviland provides clients with original, provocative, cutting-edge fundamental supply/demand and technical research on major financial marketplaces and trends. He also offers independent consulting and risk management advice.

Haviland’s expertise is macro. He focuses on the intertwining of equity, debt, currency, and commodity arenas, including the political players, regulatory approaches, social factors, and rhetoric that affect them. In a changing and dynamic global economy, Haviland’s mission remains constant – to give timely, value-added marketplace insights and foresights.

Leo Haviland has three decades of experience in the Wall Street trading environment. He has worked for Goldman Sachs, Sempra Energy Trading, and other institutions. In his research and sales career in stock, interest rate, foreign exchange, and commodity battlefields, he has dealt with numerous and diverse financial institutions and individuals. Haviland is a graduate of the University of Chicago (Phi Beta Kappa) and the Cornell Law School.


Subscribe to Leo Haviland’s BLOG to receive updates and new marketplace essays.

RSS View Leo Haviland's LinkedIn profile View Leo Haviland’s profile


AMERICAN HOUSING: A MARKETPLACE WEATHERVANE © Leo Haviland December 4, 2018

“What You Own”, a song from the musical “Rent” (by Jonathan Larson), declares: “You’re living in America at the end of the millennium- you’re living in America, where it’s like the twilight zone.”

****

OVERVIEW AND CONCLUSION

American home prices have enjoyed a joyous climb since their dismal lows following the global economic disaster of 2007-09. However, United States home prices “in general” (“overall”) now probably are establishing an important peak. At least a modest reversal of the magnificent long-run bullish United States home price trend probably is near.

What is a high (too high), low (too low), expensive, cheap, average, good, bad, neutral, normal, typical, reasonable, commonsense, appropriate, fair value, overvalued, undervalued, natural, equilibrium, rational, irrational, or bubble level for prices or any other marketplace variable is a matter of opinion. Subjective perspectives differ. In any case, current US home price levels nevertheless appear quite high, particularly in comparison to the lofty heights of the amazing Goldilocks Era. As current American home price levels (even if only in nominal terms) hover around or float significantly above those of the Goldilocks Era, this hints that such prices probably are vulnerable to a noteworthy bearish move. Moreover, measures of global home prices and US commercial real estate also have surpassed their highs from about a decade ago and thus arguably likewise may suffer declines.

Many United States housing indicators in general currently appear fairly strong, particularly in relation to their weakness during or in the aftermath of the global economic crisis. Nevertheless, assorted American housing variables as well as other phenomena related to actual home price levels probably warn of upcoming declines in American home (and arguably other real estate) prices. A couple of US home price surveys have reported price declines for very recent months. US housing affordability has declined. New single-family home sales display signs of weakness, as do new privately-owned housing starts. American government interest rate yields, as well as US mortgage rates, have edged up. The Federal Reserve Board as of now likely will continue to tighten and raise rates for a while longer. Overall household debt, though not yet burdensome (at least for many), now exceeds the pinnacle reached ten years ago in 3Q08. The economic stimulus from America’s December 2017 tax “reform” probably is fading. US consumer confidence dipped in November 2018.

Marketplace history of course does not necessarily repeat itself, either entirely or even partly. Convergence and divergence (lead/lag) relationships between marketplace trends and other variables can shift or transform, sometimes dramatically. Price and time trends for the American stock marketplace and US housing prices do not move precisely together. However, the international 2007-09 crisis experience (which in part strongly linked to US real estate issues) indicates that prices for US stocks and housing probably will peak around the same time, or at least “more or less together” (a lag of several months between the stock high and the home price pinnacle). The S+P 500 probably established a major high in autumn 2018 (9/21/18 at 2941, 10/3/18 at 2940; the broad S&P Goldman Sachs Commodity Index peaked 10/3/18 at 504). That autumn equity summit in the S+P 500 bordered 1/26/18’s interim top at 2873. Ongoing weakness in US (and international) stock marketplaces will help to undermine American home prices.

FOLLOW THE LINK BELOW to download this article as a PDF file.
American Housing- a Marketplace Weathervane (12-4-18)

GOLD AND GOLDILOCKS: 2017 MARKETPLACES © Leo Haviland, January 10, 2017

“I think I’ll go to sleep and dream about piles of gold getting bigger and bigger and bigger.” Fred C. Dobbs, in the 1948 movie, “The Treasure of the Sierra Madre” (John Huston, director)

****

CONCLUSION

The extent to which important financial playgrounds intertwine and their alleged trends converge or diverge (or, lead or lag) are matters of opinion, as are perspectives on and reasons for such relationships and movements. Apparent convergence/divergence and lead/lag patterns between currency, interest rate, stock, and commodity marketplaces nevertheless offer guidance to players seeking to explain, predict, or profit from financial price movements. Marketplace history need not repeat itself, either entirely or even in part. Thus these relationships can change, sometimes dramatically. Fundamental supply/demand factors and trends are not written in stone. And competing historians and clairvoyants do not necessarily share the same perspectives or tell the same stories regarding either a given financial playground or its relationships to other arenas.

The relationships between gold and the US dollar, as well as those between gold and other commodities and stock and interest rate marketplaces, are complex. Often, gold prices travel in roughly similar fashion to those of base metals in general and the overall petroleum complex. Yet sometimes substantial fears regarding financial meltdown (asset value destruction) or striking worries about political evolution or disruption also can influence gold’s supply/demand and price profile, and thereby gold’s interrelations with commodities as well as currency and securities marketplaces. In any case, significant gold price trend changes often precede or roughly coincide (or “confirm”) those elsewhere.

Gold probably established an important low not long ago, at $1124 on 12/15/16. Suppose this gold rally continues for at least the near term. The gold ascent probably warns of peaks in the broad real trade-weighted United States dollar (“TWD”) and the S+P 500. The current divergence between the S+P 500 and emerging marketplace nation stocks in recent months likewise warns of these trend shifts. Relevant to this viewpoint, the 10 year United States Treasury note yield established a major low at 1.32 percent on 7/6/16. In addition, suppose gold’s recent climb eventually coincides with a renewed slump in the LMEX base metals index (London Metal Exchange) from its 11/28/16 top at 2857, and at least a modest tumble in benchmark petroleum prices. That probably will interrelate with this scenario of US dollar weakness and erosion of S+P 500 and emerging marketplace stock prices.

The American political theater is relevant to this outlook for gold price and its relationship to the US dollar and other marketplaces. Trump’s remarkable Presidential victory and his likely policies probably have increased fears in both American and international domains regarding the quality of America’s political leadership and the consequences of its economic (political) philosophy. Moreover, the nation’s various sharp cultural divisions and related partisan political conflicts will not disappear anytime soon.

FOLLOW THE LINK BELOW to download this article as a PDF file.
Gold and Goldilocks- 2017 Marketplaces (1-10-17)

COMMODITIES AND US STOCKS: CONVERGENCE AND DIVERGENCE © Leo Haviland January 28, 2013

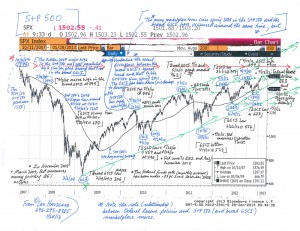
Since mid-2008, commodities “in general” and United States stocks “as a whole” have moved roughly in the same direction at around the same time. In this convergence process (relationship), noteworthy bull (bear) moves in US equities find parallels in those in the commodity arena. Thus significant marketplace rallies (declines) have tended to occur around the same time.

However, this perspective is not the only vantage point by which to assess the often close relationship between US equities and the commodities complex. There also is another, longer run view by which one can examine the relationship between them. Since spring 2011, commodities have ventured down (or sideways to down). However, key American stock benchmarks such as the S+P 500 have attained new highs, first in April 2012, then September 2012, and again in January 2013. Thus despite the convergence at assorted timely turning points since spring/ summer 2008, and even though the two territories continue to trade together to some extent, arguably there has been noteworthy divergence in their overall relationships (their trends) since May 2011.

Now recall several of 2007-08’s details. US equities peaked in October 2007, almost nine months before the commodity one in early summer 2008. Only after the final stock marketplace

summit in May 2008 did equities and commodities trade in close tandem. The current longer run relationship thus perhaps likewise reveals divergence, but with the commodity peak to date appearing well before any major S+P 500 one.

In contrast to 2007-08, what if the major peak in commodities is well before that in stocks (and the lag is likewise so great as to suggest divergence)? Suppose- and this admittedly is a key suppose- eventually commodities and US stocks will trade together over the long run. After all, so-called marketplace relationships can change dramatically, whether from the convergence/ divergence (lead/lag) perspective or otherwise. What does continued divergence, the failure of commodities to near or exceed its spring 2011 heights, suggest?

The 2007-08 relationship warns that the current continued failure of commodities to confirm the equity rally eventually will reveal a notable decline in stocks. Since the duration between the spring 2011 commodities top and today’s new highs in the S+P 500 is almost 20 months, whereas that between October 2007’s stock pinnacle and the broad GSCI’s summit in July 2008 was about nine months, the failure of the broad GSCI to achieve new heights should warn equity bulls that a decline may be fairly near in time.

S+P-500-Chart-(1-28-13,-for-essay-on-Commodities-and-US-Stocks)

FOLLOW THE LINK BELOW to download this market essay as a PDF file.
Commodities and US Stocks- Convergence and Divergence (1-28-13)
S+P 500 Chart (1-28-13, for essay on Commodities and US Stocks)

US CONSUMER CONFIDENCE: MANY HAPPY RETURNS? (c) Leo Haviland August 23, 2012

As America travels toward Labor Day, it pays to review the nation’s consumer confidence. Assorted measures perform as signposts to assess consumer attitudes and actions. For many, the United States stock marketplace (think of an “overall” benchmark such as the S+P 500) is one. The Conference Board’s United States Consumer Confidence Index is another widely watched indicator. Trends for the United States stock battleground do not precisely mirror those in the Consumer Confidence Index (“CCI”). Weathervanes such as the S+P 500 of course do not derive all their revenues or influences directly from Main Street dwellers or from American sources. The US, as the ongoing worldwide economic crisis that emerged in mid-2007 underscores, intertwines with Europe, China, Japan, and other countries around the globe. However, over the past several decades, there has been a rough link in the major patterns of the S+P 500 and the CCI. And many believe that major trends in US equities tend to parallel those of the American economy as a whole.

Stare at the S+P 500’s extensive ascent from its March 2009 abyss to its current new rally height on 8/21/12 over 1425, particularly the noteworthy stage from the October 2011 depth at 1075. Grandstanders might believe United States consumers generally are rather joyous, or that they soon will become so. The CCI indeed has climbed significantly from its February 2009 valley of 25.3 (the deepest of the 1967-present period). However, the CCI’s subsequent highs around 72.0 (February 2011 and February 2012) lurk far beneath those of 2000 and 2007 (January 2000’s 144.7 and July 2007’s 111.9). July 2012 flutters at a modest 65.9.

Admittedly the US CCI is only one yardstick for consumer confidence and thus to some extent of the strength and duration of economic recovery in America and elsewhere. Maybe sustained higher US equities and at least partial solutions to various troubles facing consumers (including those overseas) will encourage a significant CCI move over 72.0.

However, the feeble rally in the CCI in comparison with the S+P 500 since February 2009, and particularly after autumn 2011, raises significant questions regarding the present and future strength of the American economy (and even of the S+P 500). After all, US consumers are a substantial percentage (around 70 percent) of American GDP. Current US consumer confidence in context warns of economic weakness, or at least sustained sluggishness.

Summer 2012’s recent S+P 500 bull march to new highs over 1425 may continue a while longer. Yet the link between the S+P 500 and “the economy as a whole” is probably notably less than it was a several years ago. But the S+P 500 is not isolated from the economy. So this sustained mediocre (or renewed weakness in) the CCI is ominous for US stocks in general, particularly if other key consumer indicators such as housing, employment, and wages do not soon show substantial strength. Or, suppose there is not major progress on the American fiscal front.

The Gallup News Service recently polled Americans regarding their “confidence” in various “institutions in American society” (June 7-10, 2012). The category created by adding together the answers “great deal” and quite a lot” reveals dispiriting trends and levels that reflect current mediocre consumer confidence levels (as well as the broad erosion in confidence from the January 2000 CCI peak). Relatively weak consumer (Main Street) confidence in several key political and social institutions parallels many worries regarding America’s economic situation.

And anyways, America’s current national deficit and debt situation and its probable near term and long run fiscal prospects justify significant consumer concerns. Moreover, the housing, earnings, unemployment, and household debt factors also help to explain mediocre consumer confidence, both in absolute terms and relative to the S+P 500’s heights.

FOLLOW THE LINK BELOW to download this market essay as a PDF file.
US Consumer Confidence- Many Happy Returns (8-23-12)
US Consumer Confidence Chart (8-23-12)