GLOBAL ECONOMICS AND POLITICS
Leo Haviland provides clients with original, provocative, cutting-edge fundamental supply/demand and technical research on major financial marketplaces and trends. He also offers independent consulting and risk management advice.
Haviland’s expertise is macro. He focuses on the intertwining of equity, debt, currency, and commodity arenas, including the political players, regulatory approaches, social factors, and rhetoric that affect them. In a changing and dynamic global economy, Haviland’s mission remains constant – to give timely, value-added marketplace insights and foresights.
Leo Haviland has three decades of experience in the Wall Street trading environment. He has worked for Goldman Sachs, Sempra Energy Trading, and other institutions. In his research and sales career in stock, interest rate, foreign exchange, and commodity battlefields, he has dealt with numerous and diverse financial institutions and individuals. Haviland is a graduate of the University of Chicago (Phi Beta Kappa) and the Cornell Law School.
Subscribe to Leo Haviland’s BLOG to receive updates and new marketplace essays.

In the current environment, many central bankers in so-called advanced nations such as the US, Europe, Japan, and the United Kingdom (and in many other places around the globe) have adopted an inflation ideology. The IMF’s leading light heralds in her speech: “With inflation running below many central banks’ targets, we see rising risks of deflation, which could prove disastrous for the recovery. If inflation is the genie, then deflation is the ogre that must be fought decisively.” For OECD-type (advanced) countries, one can summarize the current version of that beloved doctrine: “moderate inflation of around two percent is good, lower than that is not very good (or maybe even a little bit bad), and deflation is definitely bad.” It is unclear how much inflation (in the opinion of marketplace generals these days) would be inappropriate (bad), but arguably over five percent on a sustained basis definitely would be bad (evil; monstrous).
Suppose worldwide deflationary forces remain very significant. Perhaps credit (and debt) and leverage problems developed during the Goldilocks Era (and probably during quite a few years before then) have not been solved. Suppose the worldwide economic crisis that emerged in 2007 and accelerated in 2008 did not create sufficient deflation to remedy the inflationary issues previously built up. Then lax monetary policy at best (even if accompanied by substantial deficit spending) may create mediocre real economic growth, generate less than desired (sufficient) inflation, and only modestly improve the dismal unemployment picture.
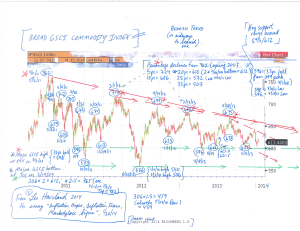
The trends of recent years show declines in real US median (and mean) income. Commodities have been in a downtrend since their peaks in spring 2011. Of course commodities are only one part of consumer price indices. And wages and incomes are not the same as consumer prices. Yet these trends in US income and the broad GSCI indicate that “inflation in general” (including such measures as the consumer price index, PCE, and GDP deflator) is strongly entrenched at low levels. In addition, unless the Fed and other central banks embark on even more massive easing than they have done thus far, this income and commodity evidence (especially when interpreted alongside the low rates of CPI-type inflation) suggests that it probably will be very difficult for “inflation in general” to rise much if at all from current low levels. And “very low” inflation (or even deflation) eventually may appear outside of the real income and commodity territories (especially if US and related interest rates leap higher).
In any event, the US income statistics and broad GSCI bear trend indicate that despite all the Fed (and other central bank) easing, the creation of sustained “sufficient” consumer price (or PCE) inflation remains a huge challenge. Given the intertwining of inflation policies and phenomena (and forecasts) with those of real GDP and unemployment, these notable wage and commodity trends hint that real GDP increases probably will be less than regulators and politicians (not just in the US) aim for, and that unemployment probably will not fall as much as desired.
FOLLOW THE LINK BELOW to download this market essay as a PDF file.
Inflation Hopes, Deflation Fears, Marketplace Signs (1-20-14)
Chart- Broad GSCI (for essay, Inflation Hopes, Deflation Fears…) (1-20-14)
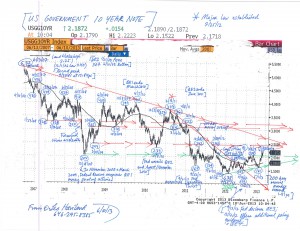
The Federal Reserve Board continues to stress via its wonderful forward guidance strategy that it will keep policy rates extremely low. However, the sustained rally in United States Treasury government yields shows that marketplace confidence in the Fed’s ability to manage (repress) interest rates, especially at the long end of the yield curve, has fallen. Look at the UST 10 year note. Not only did its yield bottom around 1.38 percent on 7/25/12. Not only did yields climb further from lows near 1.55pc (11/16/12 and 12/6/12). They have spiked from 5/1/13’s 1.61pc, touching 2.75pc 7/8/13. And this spike has continued even after the Fed underlined in recent weeks that it would not “taper” its money printing (and other easy money games) too quickly.
The ability of central bank maneuvers to sustain substantial economic growth (and repress government yields and rally the S+P 500 and related equities) probably has weakened.
Rising sovereign debt yields do not always reflect or portend economic growth (recovery) or higher stock marketplace prices. In the current marketplace playing field, rising interest rates in America (and elsewhere) also seem to be “leading” equity marketplace declines. Suppose the US government 10 year rate marches higher from current levels (or even if it stays relatively high versus its summer 2012 and May 2013 bottoms). Suppose the S+P 500 is unable to exceed (or break much above) its May 2013 height and that it declines beneath its late June 2013 low around 1560. The rising yields and falling equities will underscore that the easy money game of the Fed and its central banking allies increasingly strains credibility and thus has diminished substantially in its effectiveness.
In any event, it nevertheless stretches credibility to claim that these recent ECB and BoE statements represent a change of genuine significance. They appear to be clever ploys to boost confidence in the ability of the central banks to help guide and sustain recovery. How likely was (is) it that the ECB or the BoE were (are) going to raise rates anytime soon? Not only is much of Europe in recession, but Europe’s economic crisis (including sovereign and banking debt and related bailout issues) persists. Noteworthy troubles still loom in Greece, Ireland, Portugal, Cyprus, as well as in Spain and arguably in Italy. Moreover, recall the ECB President’s inspiring “whatever it takes” talk about a year ago (7/26/12); people gave substantial credence to that open-ended proclamation.
Consequently, these recent ECB and BoE remarks, like the cheerleading comments by Federal Reserve and Chinese officials after the June 2013 stock marketplace lows, look like a sign of weakness. Are the ECB and BoE losing some of their hold on the distant section of the yield curve? Yes. Again underscore the steady creep higher in longer run government rates in the United States (and many other arenas) despite keeping Federal Funds near the ground.
Read the rest of this entry »
The Federal Reserve Board proclaimed in June 2011 a framework of principles for an exit strategy from its extraordinary and highly accommodative monetary policy. Are their exit principles in the process of changing a little bit, and might they do so relatively soon? It seems so.
The Fed is not the only financial visionary with an exit strategy. Participants in debt, stock, currency, commodity, real estate, and other marketplaces also possess exit (and entrance) schemes and tactics.
What signs probably warn that (for whatever reason, including a potential change in Fed policy) there is a noteworthy (substantial) exit underway from long positions in the UST?
Those on the alert for bulls to exit (bears to enter) the UST corral should monitor German and Japanese sovereign debt marketplace yields. Also remember debt yields and trends for European “periphery” and emerging marketplace nations.
Of course US dollar, S+P 500, and commodity trends entangle with and help to explain exits from (and entrances into) UST (and other interest rate) playgrounds. How much convergence and divergence has there been and will there be between falling (and rising) UST yields and past and future S+P 500 patterns? If UST rates keep rising higher and higher (suppose they exceed the high achieved in the past few weeks), will the S+P 500 inevitably continue to move up and up? Other questions loom. If the Fed keeps repressing UST yields, what will the jury decide for the US dollar (either on a broad, real trade-weighted basis, or in individual crosses against the Euro FX, Japanese Yen, Chinese renminbi, and so forth).
Thus it apparently has become increasingly difficult (at least at low nominal yield levels) to captivate foreigners into buying UST notes and bonds (and T-bills too). The slowdown in overseas net buying of UST probably occurred after March 2013 as well. In this context, note the steady rise in rates since July 2012’s bottom (and the 1.55pc low on 11/16/12 and 1.56pc on 12/6/12). And after all, the US does have some inflation (now around 1.5 percent) and the first several years of the UST yield curve offers no (or very little) real return to foreigners or anyone else. The seven year note now yields around 1.60pc. Even the 10 year’s return is mediocre.
FOLLOW THE LINK BELOW to download this market essay as a PDF file.
Fed Up- Other Exit Strategies (6-10-13)
US Treasury 10 Year Note Chart (6-10-13)
Nevertheless, compare the first several years of the US Treasury yield curve relative to current and forecast inflation statistics from the CBO. Real returns look negative. The two year UST note is about .25pc, with the five year UST .65pc (under one percent). So although US inflation has been low, the Fed’s yield repression interest rate policy (whatever its merits), which probably will extend at least through end 2014, tends to cheat savers in UST (and assist the US government debtor- “We, the people”, in a representative government). Lower interest rates for the UST benchmark help to slash yields for (lower real costs for) and thus benefit other debtors/borrowers (state, local, corporate, household). Creditors/lenders correspondingly suffer via reduced real return relative to inflation. Admittedly, marketplace gardeners can argue that the Fed’s current interest rate agenda benefits “all of us” over the long run.
The Fed’s ongoing worries about unemployment in particular (and economic strength in general) underline (reflect) its willingness to suppress policy rates.
Perspectives on the output gap intertwine with analysis of and opinions regarding appropriate employment and unemployment levels. Sustained high unemployment levels may reflect a large output gap, if the economy’s productive potential remains as substantial as most economic wizards believe. However, sustained high unemployment in the face of determined longstanding Federal Reserve easing (and political deficit spending) argues that the output gap (long run productive potential) is significantly less than the IMF and Federal Reserve contend. Suppose the output gap is less than the widespread faith. Then allegedly “normal” (long run) unemployment may be greater than the Fed asserts.
So suppose unemployment unfortunately will tend to remain historically high (above current theories regarding “normal” levels) in part due to the reduction in productive potential (GDP). If so, the Fed’s well-intentioned highly accommodative policies eventually run a noteworthy risk of helping greater than desirable inflation to blossom, even if this takes an extended time to develop.
Current high unemployment levels, as well as trends in some employment measures going back to calendar 2000 (and thus preceding the economic disaster that emerged in 2007), suggest that “normal” unemployment levels probably are quite a bit higher than the Fed and many others believe. If so, America’s productive potential and its output gap also probably are less than the Fed argues.
Dig into some other key employment statistics (from the BLS; Labor Force Statistics from the Current Population Survey). Again look further backward in time than the dawn of the economic crisis in 2007. Like the official and U-6 unemployment data, both the employment-population ratio and the civilian labor force participation rate suggest that there has been a secular decline in America’s “employability potential” and productive capacity.
FOLLOW THE LINK BELOW to download this market essay as a PDF file.
The Growth Game- US Unemployment and Federal Reserve Policies (9-10-12)


