GLOBAL ECONOMICS AND POLITICS

Leo Haviland provides clients with original, provocative, cutting-edge fundamental supply/demand and technical research on major financial marketplaces and trends. He also offers independent consulting and risk management advice.

Haviland’s expertise is macro. He focuses on the intertwining of equity, debt, currency, and commodity arenas, including the political players, regulatory approaches, social factors, and rhetoric that affect them. In a changing and dynamic global economy, Haviland’s mission remains constant – to give timely, value-added marketplace insights and foresights.

Leo Haviland has three decades of experience in the Wall Street trading environment. He has worked for Goldman Sachs, Sempra Energy Trading, and other institutions. In his research and sales career in stock, interest rate, foreign exchange, and commodity battlefields, he has dealt with numerous and diverse financial institutions and individuals. Haviland is a graduate of the University of Chicago (Phi Beta Kappa) and the Cornell Law School.


Subscribe to Leo Haviland’s BLOG to receive updates and new marketplace essays.

RSS View Leo Haviland's LinkedIn profile View Leo Haviland’s profile


AS THE FINANCIAL WORLD TURNS: COMMODITY AND OTHER MARKETPLACE DOMAINS © Leo Haviland April 2, 2018

Chuck Berry sings in “’Round and ’Round”:
“Well, the joint started rockin’
Goin’ round and round,
Yeah, reelin’ and a rockin’,
What a crazy sound,
Well, they never stopped rockin’,
’Till the moon went down”.

****

OVERVIEW AND CONCLUSION

Many marketplace high priests enthusiastically proclaim proverbs on price relationships. For some heralds, these adages are only guidelines; however, for others, they represent high (or very high) probabilities. Such aphorisms include the links between the United States dollar and commodities “in general”, or between the US dollar and the S+P 500 or other stock indices. For example, one widely popular chant: “weak dollar equals strong commodities”, “strong dollar equals weak commodities”. For some, the word “equals” in this formula implies “is connected to”, or “associated with”.

Observers differ, often substantially, in their choice between as well as the assessment of the supposedly relevant variables (data, evidence) and analytical time horizons. Perspectives on past, current, and future convergence and divergence (lead/lag) relationships between financial marketplaces (and factors influencing them) likewise can vary significantly.

In practice, viewpoints regarding the role of the dollar in determining commodity price levels, trends, and turning points nevertheless differ, and often a great deal. After all, other financial marketplace realms (such as interest rates and stocks), diverse economic and political theaters, and a wide range of other phenomena interrelate with both the dollar (and other currencies) and assorted members of the commodities world. So a variety of competing stories and predictions about the dollar, commodities (whether in general or in regard to individual sectors such as petroleum or base metals), and other marketplaces exist and change.

Moreover, historical review indicates that trends for commodities “in general” can intertwine in various fashions with currencies (such as the United States dollar), as well as with interest rate benchmarks (picture the US 10 year government note), and stock playgrounds (the S+P 500 and related indices of advanced nations; emerging marketplace signposts). Moreover, marketplace history, whether for a given arena or the relationship between two or more fields, is not marketplace destiny.

For further related marketplace analysis of stock, interest rate, currency, and commodity fields, see other essays such as: “Global Stock Marketplaces: Winter of Discontent” (3/5/18); “There Will Be Blood: Financial Battlefields” (2/9/18); “Busload of Faith: Financial Marketplaces” (1/15/18); “Marketplace Vehicles: Going Mobile” (12/13/17); “History on Stage: Marketplace Scenes” (8/9/17).

****

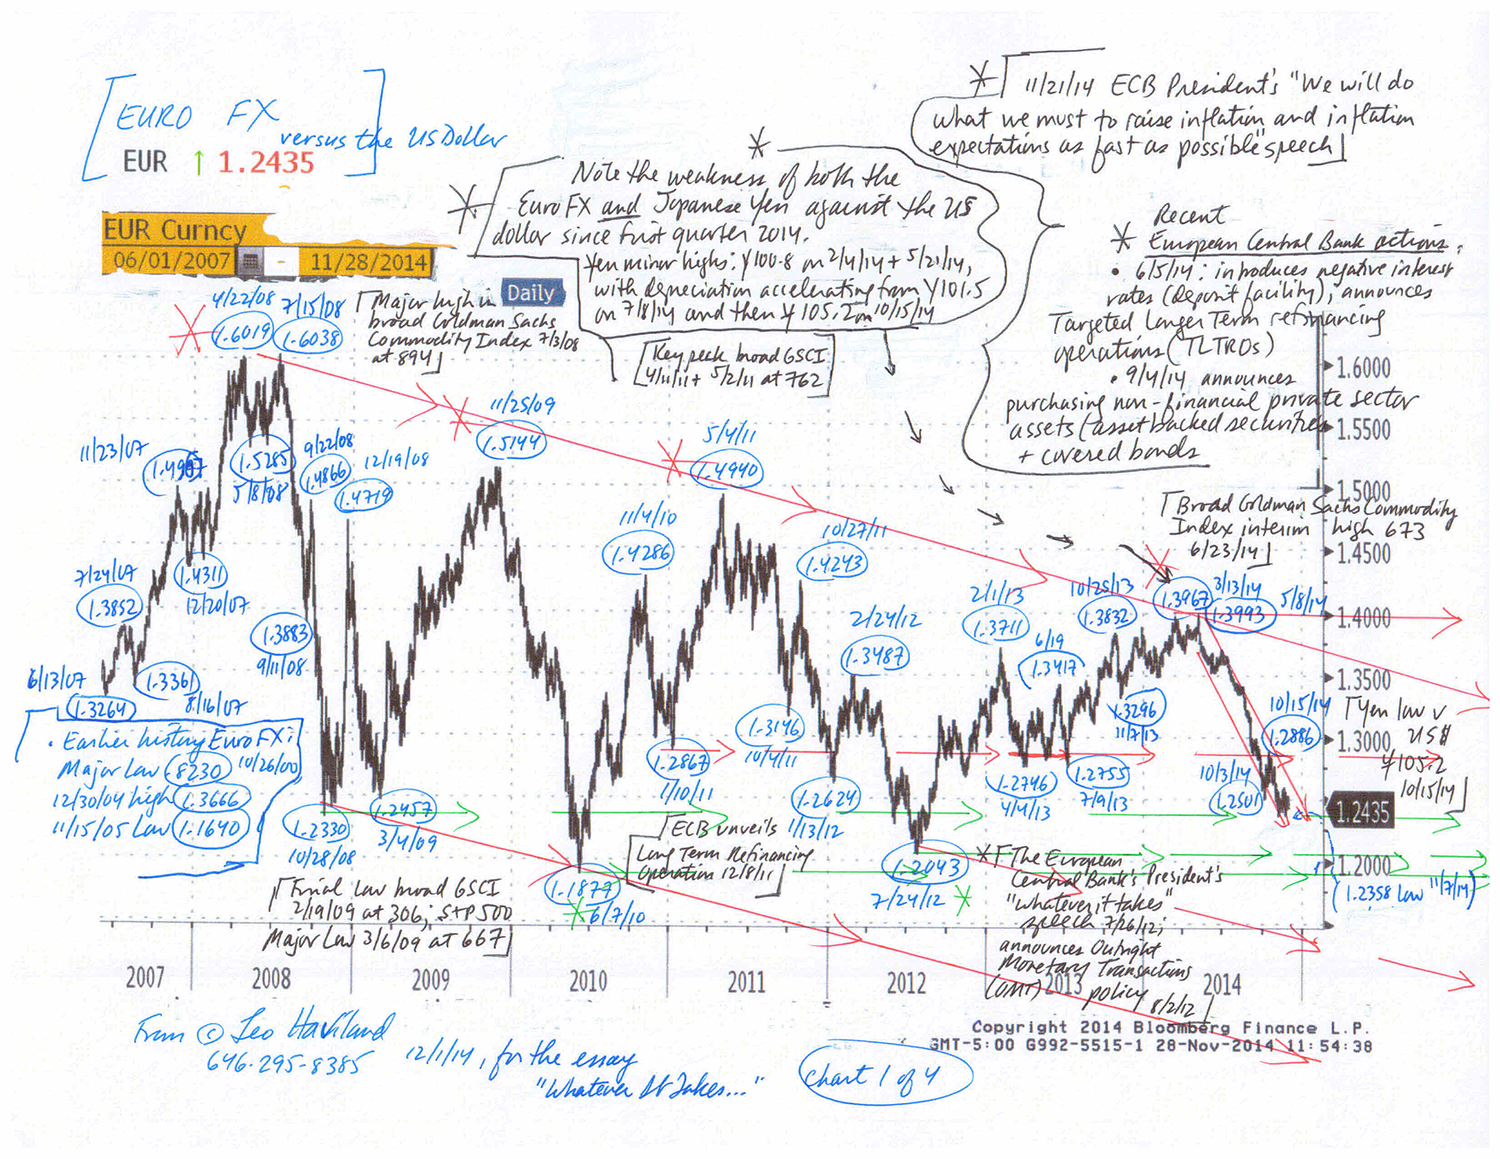
In any case, let’s now focus on the historical relationship between the broad real trade-weighted US dollar (“TWD”) and commodities in general over the past several years. The table below underlines that players should be on the watch for a fairly close coincidence in timing of major or other important turning points in those two wide realms. However, in the current context, they also should monitor TWD moves in relation to the critical height around 96.0. The broad real trade-weighted US dollar (“TWD”) recently fell decisively beneath crucial support around 96.2 to 96.6. The broad real TWD high during the global financial disaster was March 2009’s 96.6.

****

What does an investigation of the petroleum, base metals, and agricultural commodity groups since their first quarter 2016 major lows unveil? Many marketplace turns have occurred around the same time. All these commodity battlefields made important highs in first quarter 2018; so did the S+P 500 and other important advanced nation and emerging marketplace stock indices.

Yet not all commodity sectors (or members within a group) necessarily dance (make turns) together. In principle and practice, potential divergence can develop and persist within the commodity universe.

However, whereas petroleum arguably very recently threatened to exceed its 1Q18 barriers, base metals and agriculture apparently did not. Determined and sustained crude oil output restraint by OPEC and its non-OPEC allies such as Russia has helped to draw down OECD petroleum industry inventories. Fears of supply interruption (Middle East tension, including the Iran nuclear issue; Libya; Nigeria; Venezuela) exist. Numerous prophets assert the world economy will remain robust. The further weakening of the dollar since around mid-year 2017 has inspired some petroleum bulls.

The net noncommercial long position of petroleum players (see the CFTC Commitments of Traders) expanded massively since mid-2017, and this net noncommercial buying probably played an important role in rallying oil prices. It remains very large and is vulnerable to liquidation.

Prices for the oil group probably will not break above their first quarter 2018 highs by much if at all. Neither will broad commodity indices such as the broad S&P Goldman Sachs Commodity Index or the Bloomberg Commodity Index. The 1Q18 peaks in the S+P 500 and MXEF stock indices are two year diagonal bull time moves from their 1Q16 major troughs. The GSCI and BCI’s first quarter 2018 highs likewise are two year diagonal ascents from their major bottoms of 1Q16.

Yet suppose the petroleum complex does attain new highs relative to those of 1Q18. As petroleum is an important part of many widely-watched commodity signposts (especially the broad S&P Goldman Sachs Commodity Index), that may boost such broad indices to levels above first quarter resistance.

It is important whether or not the base metals crew (copper, aluminum, zinc, and others) also achieves new highs, for both base metals and oil link closely to international economic growth trends (and arguably more “immediately” than agriculture does).

Many major highs (lows) for commodities “in general” have roughly coincided with major peaks (bottoms) in the S+P 500. But not all have. The 2007-2009 global economic disaster era displayed an exception. The major high in the S+P 500 (10/11/07 at 1576) preceded the GSCI’s pinnacle (7/3/08 at 894). However, the S+P 500’s final top, 5/19/08’s 1440, bordered the July 2018 commodities summit.

****

Regardless of whether or not key commodity indices achieve highs above their first quarter 2018 plateau, the first quarter 2018 resistance for the S+P 500 and other advanced and emerging marketplace equity benchmarks probably will remain in place. As “There Will Be Blood: Financial Battlefields” (2/9/18) stated: “The S+P 500’s recent high, 1/26/18’s 2873, probably was a major top.”

FOLLOW THE LINK BELOW to download this article as a PDF file.
As the Financial World Turns- Commodity and Other Marketplace Domains (4-2-18)

GLOBAL STOCK MARKETPLACES: WINTER OF DISCONTENT © Leo Haviland March 5, 2018

“I’m goin’ down the road feelin’ bad
I don’t want to be treated this-a-way.” Bill Monroe, the Grateful Dead, and other musicians have performed versions of the traditional song, “Goin’ Down the Road Feelin’ Bad”

****

OVERVIEW AND CONCLUSION

American stock indices “in general” inspire an assortment of stories regarding them, including reasons for their past, present, and future levels and trends. Many of these descriptions and analyses regarding broad benchmarks such as the S+P 500 and Dow Jones Industrial Average appear relatively unique to the United States. However, economic regions and financial marketplaces around the world have increasingly intertwined during the course of globalization in recent decades, and especially during the past several years.

Therefore the directional travels (bull and bear adventures) of America’s stock marketplace increasingly have tended to parallel those of other significant advanced countries and regions. In recent years, the trends of emerging marketplace stocks “in general” increasingly have interconnected with those of leading advanced nations. Consequently, narratives and explanations regarding a broad “national” stock marketplace indicator such as the S+P 500 often involve those of equity barometers elsewhere (as well as interest rate, currency, and commodity movements).

****

History underscores that across the fields of these various stock marketplace signposts, the timing of key price turns and the duration and extent (percentage distance travelled) of very important trend moves are not always exactly the same or extremely close. But they often are.

****

After establishing important bottoms together in first quarter 2016 (and during the preceding price decline), the key American stock indices and those of other important advanced nations and the “overall” emerging stock marketplace have traded closely together from the directional and marketplace timing perspective. Though the bull moves since first quarter 2016 in these assorted domains did not all cover the same distance, all were very substantial. Their rallies since around the time of the November 2016 United States Presidential election were impressive. Investors and other stock owners, Wall Street, and the financial media cheered the majestic ascent. Heated advice to “buy the dip” became widespread as the S+P 500 climbed and as price declines tended to become less substantial in percentage terms.

However, the glorious bull move in American and other related stock marketplace halted in first quarter 2018. A mournful “correction”, a decline of roughly ten percent, ensued. The disturbing decline in the S+P 500 and other significant global stock marketplace indices probably will continue. However, if the S+P 500 and other equity benchmarks manage to surpass their January 2018 highs, they probably will not do so by much.

****

For further economic and political analysis, see “There Will Be Blood: Financial Battlefields” (2/9/18), “Busload of Faith: Financial Marketplaces” (1/15/18), “Marketplace Vehicles: Going Mobile” (12/13/17), “History on Stage: Marketplace Scenes” (8/9/17), and other essays.

FOLLOW THE LINK BELOW to download this article as a PDF file.
Global Stock Marketplaces- Winter of Discontent (3-5-18)

WHATEVER IT TAKES: RECENT EUROZONE AND JAPANESE ADVENTURES © Leo Haviland December 1, 2014

The Euro FX and Japanese Yen for several months have been weakening together, both against the US dollar and on an effective exchange rate basis. This currency relationship and bear trend will continue. Despite the Eurozone’s and Japan’s brave quests to create sufficient inflation (escape deflation), their success probably will be limited; inflation and longer term government interest rates probably will not sustain significant increases. However, even if substantial currency depreciation and massive money printing manage to achieve an inflation goal (and higher interest rates), they likely will not generate sustained economic growth.

Given that both the Eurozone and Japan suffer from low growth and deflationary challenges and fears, is weakness in the Euro FX connected with (encouraging that of) the Japanese Yen? Is the Yen’s swoon helping to depreciate the Euro FX? Are Japan and the Eurozone (and other nations) engaged in competitive devaluations (currency wars) to bolster growth?

One sign of the obstacles facing the Eurozone and Japan in their quest to boost inflation (and generate higher interest rates) is the recent behavior of the UST 10 year government note. American GDP recently has been robust, rising at an annual rate of 4.6 percent in 2Q14 and 3.9pc in 3Q14. However, the UST 10 year yield around 2.20pc remains well beneath its 1/2/14 top at 3.05pc. Admittedly the UST yield bounced up from the 1.86pc low of 10/15/14. But even since that mid-October 2014 depth, yields traveled up to only around 2.40pc, never piercing the important resistance around that level. The failure of UST yields to rally may signal future mediocre US (and worldwide) economic growth since yields generally advance during recovery (or hope of one).

Take the broad Goldman Sachs Commodity Index (GSCI) as a benchmark for commodities “in general”. It collapsed, of course aided by price dives in the petroleum complex, from 6/23/14’s interim high around 673 to under 520 recently. If sustained, this bloody price retreat will cut many statistical measures of inflation (and perhaps reduce inflation expectations). Thus it may encourage European and Japanese (and other) policy makers to embark on especially accommodative monetary policies. For example, the ECB may decide it has more need (justification) to quickly engage in massive QE, perhaps even by sovereign debt buying.

However, this GSCI weakness also may indicate underlying and ongoing risks to global economic growth as well as the difficulty of generating sufficient inflation in general. Moreover, sustained declines in petroleum prices may create crises in some producing nations that in turn spill over into other nations. For example, think of Russia (the ruble has moved over 50 versus the dollar), Nigeria, and Venezuela.

Charts--FX-and-10-Yr-Govt-Note-of-Eurozone-and-Japan-(12-1-14,-for-essay-Whatever-It-Takes)-1

Charts--FX-and-10-Yr-Govt-Note-of-Eurozone-and-Japan-(12-1-14,-for-essay-Whatever-It-Takes)-2

Charts--FX-and-10-Yr-Govt-Note-of-Eurozone-and-Japan-(12-1-14,-for-essay-Whatever-It-Takes)-3

Charts--FX-and-10-Yr-Govt-Note-of-Eurozone-and-Japan-(12-1-14,-for-essay-Whatever-It-Takes)-4

FOLLOW THE LINK BELOW to download this article as a PDF file.
Whatever It Takes- Recent Eurozone and Japanese Adventures (12-1-14)
Charts- FX and 10 Yr Govt Note of Eurozone and Japan (12-1-14, for essay Whatever It Takes)

OF HUMAN BONDAGE- GOVERNMENT NOTE MARKETPLACES © Leo Haviland, April 9, 2012

Recent patterns in key government interest rate marketplaces warn that the worldwide economic crisis remains far from over.

Since around mid-March 2012, compare the trend of falling rates in government notes (10 year) of “flight to quality”/”safe haven” nations such as the USA, Germany, and Japan (and even the UK) with that of rising yields in several other European nations (not just Italy and Spain).

Note this rate pattern in government debt instruments alongside the recent high in the S+P 500 at 4/2/12 at 1422 as well as related weakness in commodities “in general”. See “The Worldwide Economic Growth Story: Chinese and Indian Stocks Alongside Commodities” (4/2/12).

FOLLOW THE LINK BELOW to download this market essay as a PDF file.
Of Human Bondage- Government Note Marketplaces (4-9-12)
Government Note Marketplaces (4-9-12)