GLOBAL ECONOMICS AND POLITICS

Leo Haviland provides clients with original, provocative, cutting-edge fundamental supply/demand and technical research on major financial marketplaces and trends. He also offers independent consulting and risk management advice.

Haviland’s expertise is macro. He focuses on the intertwining of equity, debt, currency, and commodity arenas, including the political players, regulatory approaches, social factors, and rhetoric that affect them. In a changing and dynamic global economy, Haviland’s mission remains constant – to give timely, value-added marketplace insights and foresights.

Leo Haviland has three decades of experience in the Wall Street trading environment. He has worked for Goldman Sachs, Sempra Energy Trading, and other institutions. In his research and sales career in stock, interest rate, foreign exchange, and commodity battlefields, he has dealt with numerous and diverse financial institutions and individuals. Haviland is a graduate of the University of Chicago (Phi Beta Kappa) and the Cornell Law School.


Subscribe to Leo Haviland’s BLOG to receive updates and new marketplace essays.

RSS View Leo Haviland's LinkedIn profile View Leo Haviland’s profile


WHATEVER IT TAKES: RECENT EUROZONE AND JAPANESE ADVENTURES © Leo Haviland December 1, 2014

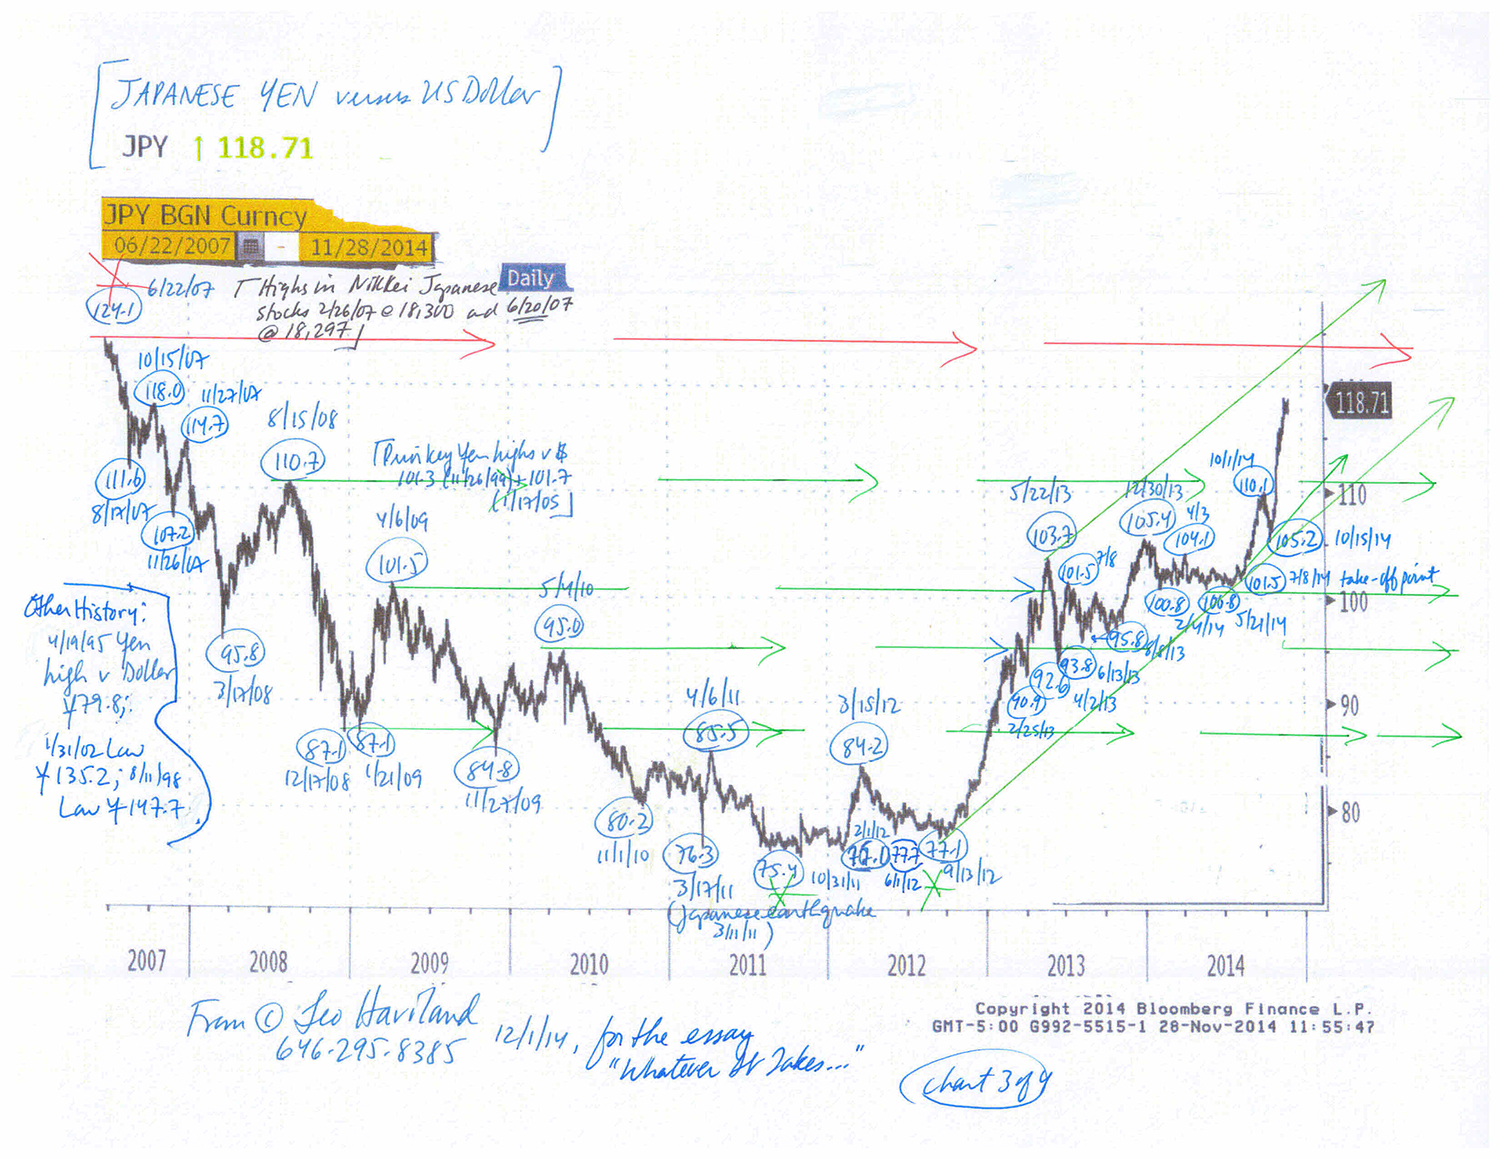
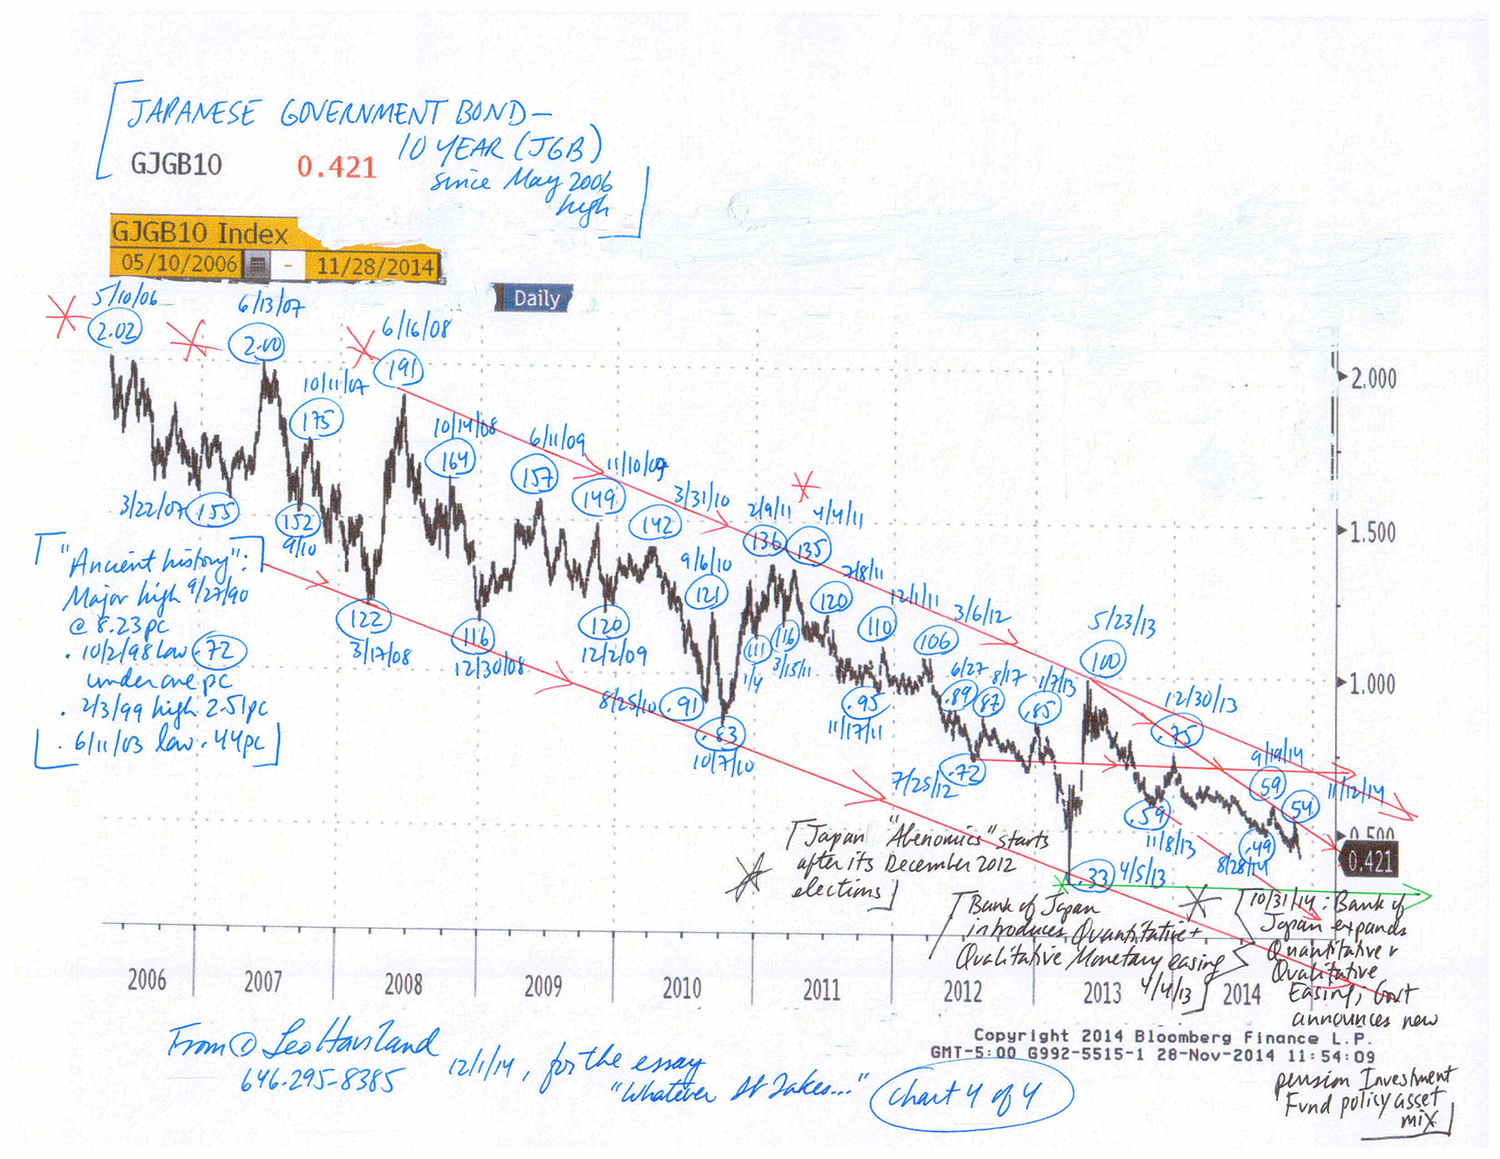
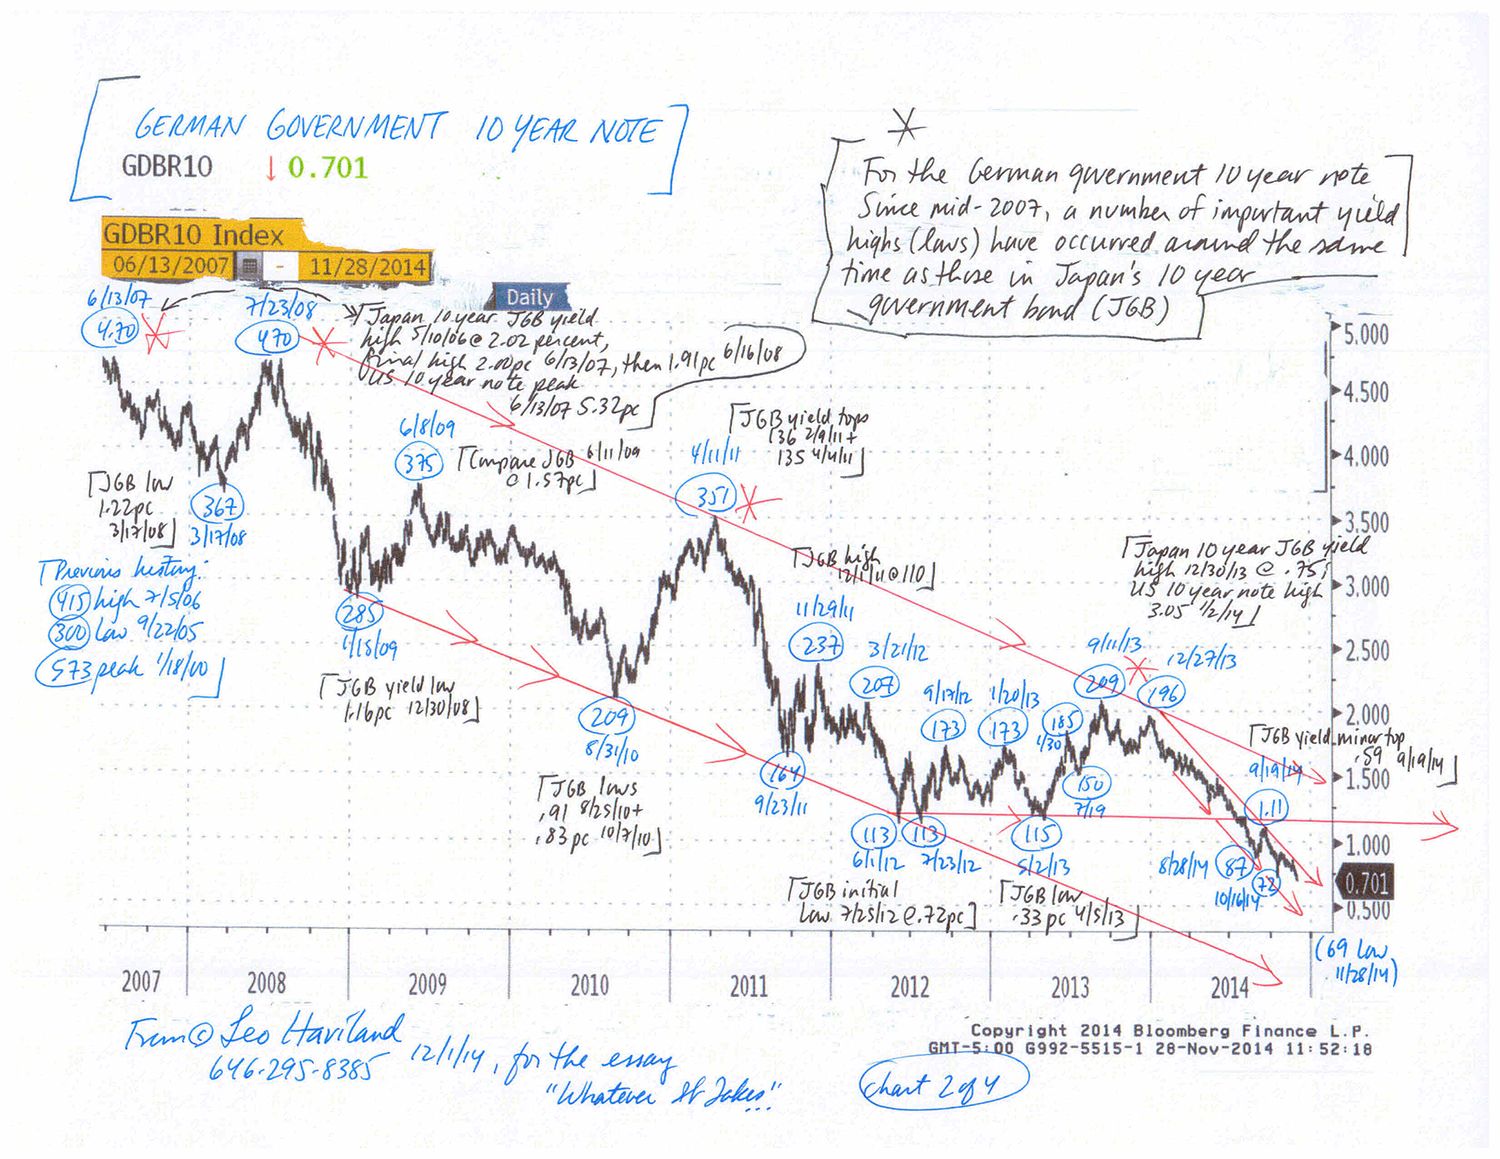
The Euro FX and Japanese Yen for several months have been weakening together, both against the US dollar and on an effective exchange rate basis. This currency relationship and bear trend will continue. Despite the Eurozone’s and Japan’s brave quests to create sufficient inflation (escape deflation), their success probably will be limited; inflation and longer term government interest rates probably will not sustain significant increases. However, even if substantial currency depreciation and massive money printing manage to achieve an inflation goal (and higher interest rates), they likely will not generate sustained economic growth.

Given that both the Eurozone and Japan suffer from low growth and deflationary challenges and fears, is weakness in the Euro FX connected with (encouraging that of) the Japanese Yen? Is the Yen’s swoon helping to depreciate the Euro FX? Are Japan and the Eurozone (and other nations) engaged in competitive devaluations (currency wars) to bolster growth?

One sign of the obstacles facing the Eurozone and Japan in their quest to boost inflation (and generate higher interest rates) is the recent behavior of the UST 10 year government note. American GDP recently has been robust, rising at an annual rate of 4.6 percent in 2Q14 and 3.9pc in 3Q14. However, the UST 10 year yield around 2.20pc remains well beneath its 1/2/14 top at 3.05pc. Admittedly the UST yield bounced up from the 1.86pc low of 10/15/14. But even since that mid-October 2014 depth, yields traveled up to only around 2.40pc, never piercing the important resistance around that level. The failure of UST yields to rally may signal future mediocre US (and worldwide) economic growth since yields generally advance during recovery (or hope of one).

Take the broad Goldman Sachs Commodity Index (GSCI) as a benchmark for commodities “in general”. It collapsed, of course aided by price dives in the petroleum complex, from 6/23/14’s interim high around 673 to under 520 recently. If sustained, this bloody price retreat will cut many statistical measures of inflation (and perhaps reduce inflation expectations). Thus it may encourage European and Japanese (and other) policy makers to embark on especially accommodative monetary policies. For example, the ECB may decide it has more need (justification) to quickly engage in massive QE, perhaps even by sovereign debt buying.

However, this GSCI weakness also may indicate underlying and ongoing risks to global economic growth as well as the difficulty of generating sufficient inflation in general. Moreover, sustained declines in petroleum prices may create crises in some producing nations that in turn spill over into other nations. For example, think of Russia (the ruble has moved over 50 versus the dollar), Nigeria, and Venezuela.
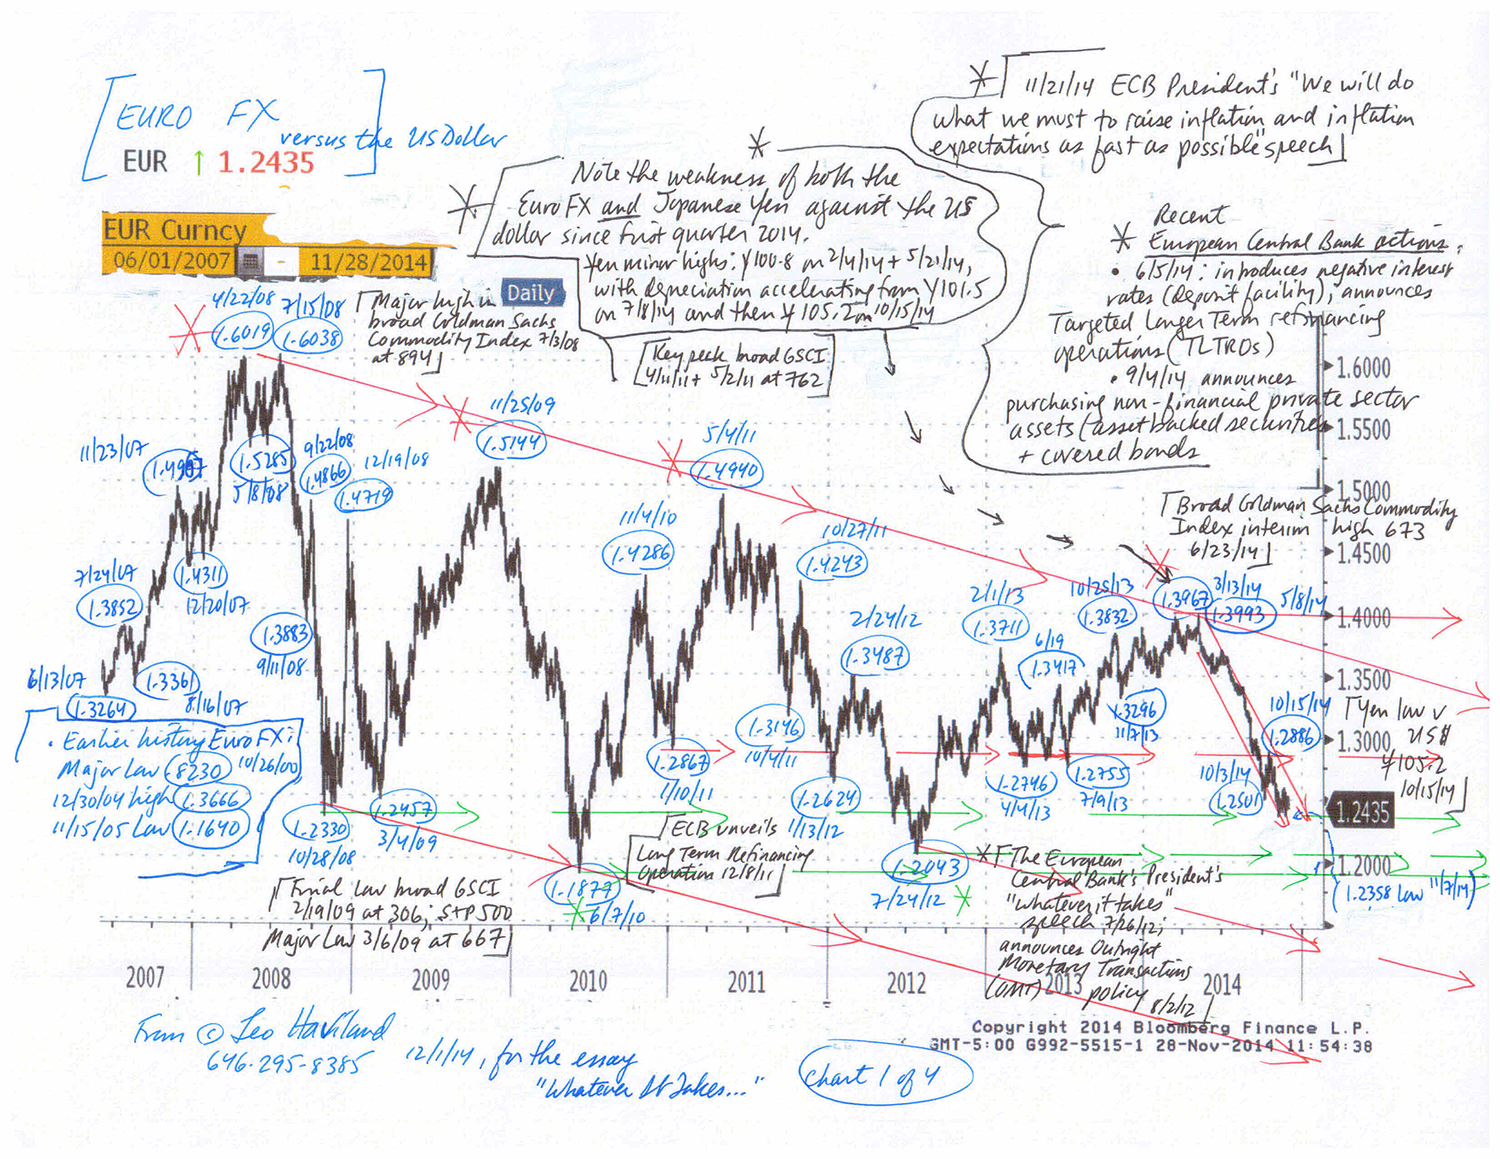
Charts--FX-and-10-Yr-Govt-Note-of-Eurozone-and-Japan-(12-1-14,-for-essay-Whatever-It-Takes)-1

Charts--FX-and-10-Yr-Govt-Note-of-Eurozone-and-Japan-(12-1-14,-for-essay-Whatever-It-Takes)-2

Charts--FX-and-10-Yr-Govt-Note-of-Eurozone-and-Japan-(12-1-14,-for-essay-Whatever-It-Takes)-3

Charts--FX-and-10-Yr-Govt-Note-of-Eurozone-and-Japan-(12-1-14,-for-essay-Whatever-It-Takes)-4

FOLLOW THE LINK BELOW to download this article as a PDF file.
Whatever It Takes- Recent Eurozone and Japanese Adventures (12-1-14)
Charts- FX and 10 Yr Govt Note of Eurozone and Japan (12-1-14, for essay Whatever It Takes)

CURRENCY CONTEXTS: RECENT RALLIES IN THE DOLLAR AND RENMINBI © Leo Haviland November 9, 2014

Currency marketplace watchers generally concentrate their attention on important cross rate relationships such as the US dollar against the Euro FX, Canadian dollar, Japanese Yen, or Chinese renminbi. However, broad real currency indices (trade-weighted or effective exchange rate) offer greater insight regarding the actual overall strength (or weakness) of any given currency than does a particular cross rate. Thus the broad real trade-weighted dollar is a more comprehensive benchmark for “the dollar in general” and its relationship with debt, stock, commodity, and other arenas.

As the Goldilocks Era faded and the dreadful worldwide economic disaster of 2007-09 unfolded, not only did US Treasury yields collapse alongside massive falls in the S+P 500, emerging marketplace equities, and commodities. During the darkest times of that global financial crisis, the broad real US dollar, Japanese Yen, and Chinese renminbi all appreciated sharply.

Though the renminbi has advanced relative to the dollar since around late April 2014, the broad real (effective exchange rate) yardsticks for both the renminbi and the dollar have rallied together (moved upwards) in recent months (since around mid-2014). In contrast to these bull moves in broad real exchange rates for the renminbi and the dollar, Japan’s real effective exchange rate weakened further in recent months. Moreover, despite the Yen’s depreciation, this simultaneous recent strength in both the dollar and the renminbi overlaps with (confirms) declines in UST 10 year yields and slumps in emerging marketplace stocks and commodities. In this context, in a world of interrelated marketplace battlefields, and given the increasing importance of China in the international economy, the hand-in-hand (joint) rally in the broad real dollar and renminbi indices also warns that a notable top in the S+P 500 may soon emerge.

The recent declines in the Yen and the Euro FX probably hint that the worldwide economy is weakening, not strengthening. Note too the indications of a slowdown in China’s enviable GDP growth rate. In this context, dramatic falls in currencies such as the Russian ruble also can signal or spark potentially more widespread weakness.

The upward trends in the broad real trade-weighted dollar and the renminbi real effective exchange rates probably will continue. For the near term, the Yen’s effective exchange rate probably will remain relatively weak. However, if the world economic situation worsens significantly relative to the current scene, since the Yen appreciated very sharply during the 2007-2009 crisis, the Yen may depart from its current bearish path and venture somewhat higher.
Chart--Chinese-Renminbi-(11-9-14,-for-essay-Currency-Contexts)

FOLLOW THE LINK BELOW to download this article as a PDF file.
Currency Contexts- Recent Rallies in the Dollar and Renminbi (11-9-14)
Chart- Chinese Renminbi (11-9-14, for essay Currency Contexts)

US NATURAL GAS TRAVELS: RUNNING BACK AND FORTH © Leo Haviland November 2, 2014

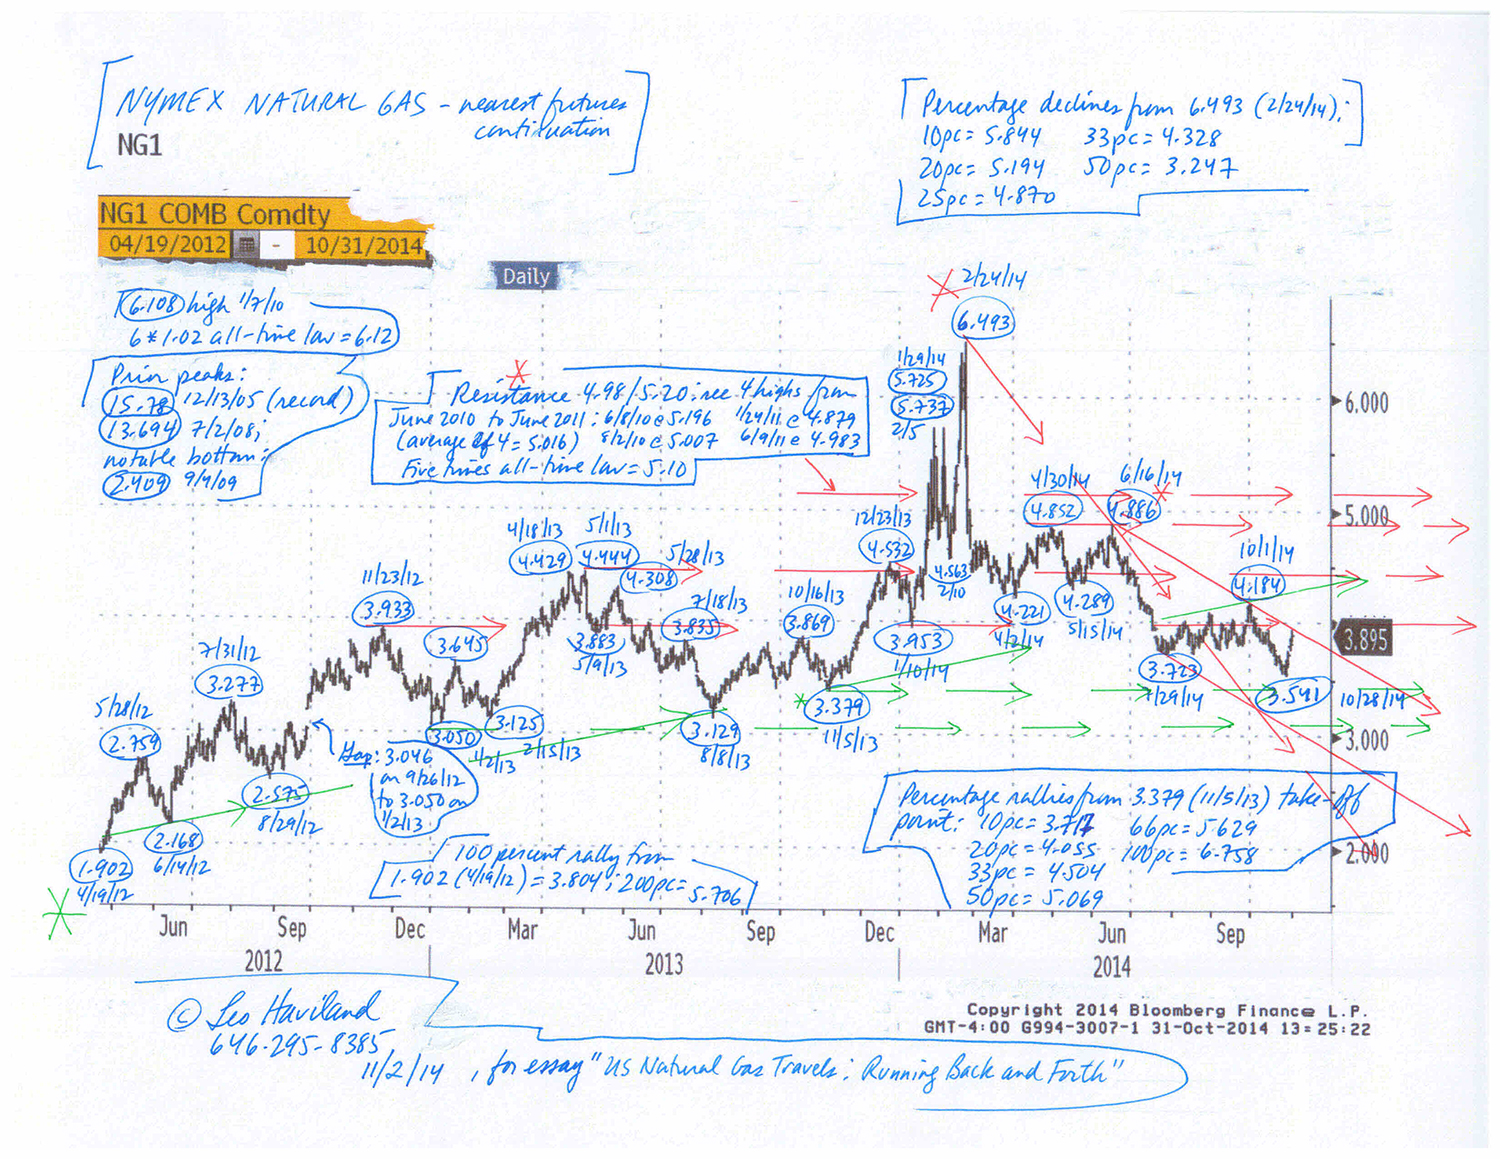
Assume normal weather for the United States natural gas 2014-15 winter draw period. Then the NYMEX natural gas complex in general probably will trade in a sideways trend. The broad range remains roughly 5.00/5.20 to 3.38/3.55 (NYMEX nearest futures continuation contract).

Unless the upcoming winter is much warmer than normal (or fears grow that it will be), or unless gas production spikes more than most prophets predict, then prices for NYMEX nearest futures probably will not attack major support around 3.00/3.13 during the next several months. Recall the 3.05 bottom on 1/2/13 (and the gap relative to the 3.046 high on 9/26/12) as well as 2/15/13’s 3.125 low and 8/8/13’s 3.129 trough. Given the low days coverage inventory situation, the NYMEX nearest futures continuation contract probably will challenge the 5.00/5.20 range during this upcoming draw season if the winter is significantly colder than normal (or concerns increase that it will be).

Despite the leap in United States natural gas production in calendar 2014, with a further moderate increase expected in 2015, natural gas days coverage at the end of October 2014 is significantly below average. Even by end March 2015, inventory days coverage probably will remain moderately below average (normal, typical, desired, reasonable, prudent) levels, though less so than at end October 2014. And though much can happen between now and October 2015, days coverage at end October 2015 arguably will rest under average levels.
Chart--NYMEX-natural-gas-(nearest-futures)-(11-2-14,-for-essay-US-Natural-Gas-Travels)

FOLLOW THE LINK BELOW to download this article as a PDF file.
US Natural Gas Travels- Running Back and Forth (11-2-14)
Chart- NYMEX natural gas (nearest futures) (11-2-14, for essay US Natural Gas Travels)

TALKING THE TALK: MARKETPLACE PARALLELS © Leo Haviland October 19, 2014

Marketplace history of course does not necessarily repeat itself, either in whole or in part. However, sometimes it does. In any case, it should not be forgotten. Storytellers reveal (construct, create) parallels (and differences) between the marketplace past and present, not only to explain ancient times and the current situation, but also to predict future phenomena.

Coincidentally, the S+P 500’s recent high at 2019 on 9/19/14 occurred almost exactly on the sixth anniversary of Lehman Brothers’ 9/15/08 bankruptcy filing. Around the time of that autumn 2008 event, the fearsome worldwide economic crisis that emerged in mid-2007 accelerated.

Yet not so coincidentally, many recent intertwined dramatic marketplace moves in interest rate, stock, currency, and commodity arenas bear significant resemblance to those of the 2007-09 theater. Why? Problems now echo those of the prior period. Some troubles represented by that supposedly distant past have not been sufficiently fixed. In addition, some excesses of that long ago time, even if in somewhat different ways, have reappeared.

In regard to the current vista, underline several trend interrelations between key playgrounds. Focus on the time dimension in this context. Note not only the US Treasury 10 year note’s yield decline since its 1/2/14 top at 3.05pc (and the narrowing of the 10 year less two year UST spread), but also the UST’s yield slump from 9/19/14’s 2.65pc and its break under key support around 2.40 percent. The S+P 500 fell nearly ten percent following 9/19/14’s 2019 plateau. In addition, the recent peak in emerging marketplace stocks (“MXEF”; MSCI Emerging Stock Markets Index, from Morgan Stanley) on 9/4/14 at 1104 occurred close in time to both the S+P 500’s recent high as well as the rally in the broad real trade-weighted US dollar. Moreover, recall the sharp retreat in the broad Goldman Sachs Commodity Index since 6/23/14’s 673 interim top, particularly its recent decisive break under important support at 595/612.

The current and future marketplace theater probably will not duplicate the scope of the 2007-09 global economic disaster. Nevertheless, despite the passage of several years, significant deficit spending by America and other key nations, and widespread extraordinary central bank easy money policies (conjure up the Federal Reserve’s yield repression and money printing schemes), we have not entirely escaped the horrific days of the 2007-09 era.

The major bull move from the S+P 500’s 10/10/02 bottom at around 769 to 2007’s lofty 10/11/07 major high at 1576 lasted five years. The October 2002 bottom times two is 1538, or within about three percent the October 2007 peak. Since the S+P 500 achieved its major bottom on 3/6/09 at 667, its bull move has run about five and a half years, even longer than 2002-07’s advance. Whereas S+P 500 prices doubled over the 2002-07 span, 9/19/14’s height at 2019 triples March 2009’s major bottom (doubles 7/1/10’s 1011 trough; and jumps about 50 percent over 11/16/12’s 1343 low).

Given that the S+P 500’s major bull move since March 2009 was even longer-lasting and stratospheric than the preceding one, observers should be watchful for a very noteworthy S+P 500 decline, extending (or greater than) the one that so far since 9/19/14 has reached around ten percent. With parallels between the 2007-09 world and the current environment in mind (given the recent moves in the UST 10 year, emerging marketplace stocks, the broad real trade-weighted dollar, and the broad GSCI), the S+P 500’s 9/19/14 height probably represents an important top. If that top is broken, it probably will not be exceeded by much.

Incidentally, for those seeking further timing parallels in the S+P 500, the 9/19/14 date is not far from the October 2002 and 2007 calendar tops and bottoms (10/10/02; 10/11/07), but also 10/4/11’s important low at 1075.

Looking forward, since history need not repeat itself, the Fed’s eloquence and actions may not always achieve the goals the Fed diligently seeks. Continued or even increased easing, whether by the Fed or other important central banks, do not inevitably produce rallies in the S+P 500 (or a continued economic recovery).

FOLLOW THE LINK BELOW to download this article as a PDF file.
Talking the Talk- Marketplace Parallels (10-19-14) (1)
Charts- Ten Yr UST, S+P 500, GSCI, Corp Bond (10-19-14, for essay Talking the Talk- Marketplace Parallels)